Philips 2004 Annual Report Download - page 146
Download and view the complete annual report
Please find page 146 of the 2004 Philips annual report below. You can navigate through the pages in the report by either clicking on the pages listed below, or by using the keyword search tool below to find specific information within the annual report.-
 1
1 -
2
-
3
-
4
-
5
-
6
-
7
-
8
-
9
-
10
-
11
-
12
-
13
-
14
-
15
-
16
-
17
-
18
-
19
-
20
-
21
-
22
-
23
-
24
-
25
-
26
-
27
-
28
-
29
-
30
-
31
-
32
-
33
-
34
-
35
-
36
-
37
-
38
-
39
-
40
-
41
-
42
-
43
-
44
-
45
-
46
-
47
-
48
-
49
-
50
-
51
-
52
-
53
-
54
-
55
-
56
-
57
-
58
-
59
-
60
-
61
-
62
-
63
-
64
-
65
-
66
-
67
-
68
-
69
-
70
-
71
-
72
-
73
-
74
-
75
-
76
-
77
-
78
-
79
-
80
-
81
-
82
-
83
-
84
-
85
-
86
-
87
-
88
-
89
-
90
-
91
-
92
-
93
-
94
-
95
-
96
-
97
-
98
-
99
-
100
-
101
-
102
-
103
-
104
-
105
-
106
-
107
-
108
-
109
-
110
-
111
-
112
-
113
-
114
-
115
-
116
-
117
-
118
-
119
-
120
-
121
-
122
-
123
-
124
-
125
-
126
-
127
-
128
-
129
-
130
-
131
-
132
-
133
-
134
-
135
-
 136
136 -
 137
137 -
 138
138 -
 139
139 -
 140
140 -
 141
141 -
 142
142 -
 143
143 -
 144
144 -
 145
145 -
 146
146 -
 147
147 -
 148
148 -
 149
149 -
 150
150 -
 151
151 -
 152
152 -
 153
153 -
 154
154 -
 155
155 -
 156
156 -
157
-
158
-
159
-
160
-
161
-
162
-
163
-
164
-
165
-
166
-
167
-
168
-
169
-
170
-
171
-
172
-
173
-
174
-
175
-
176
-
177
-
178
-
179
-
180
-
181
-
182
-
183
-
184
-
185
-
186
-
187
-
188
-
189
-
190
-
191
-
192
-
193
-
194
-
195
-
196
-
197
-
198
-
199
-
200
-
201
-
202
-
203
-
204
-
205
-
206
-
207
-
208
-
209
-
210
-
211
-
212
-
213
-
214
-
215
-
216
-
217
-
218
-
219
 |
 |

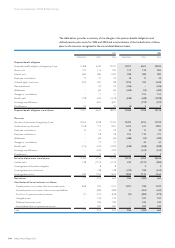
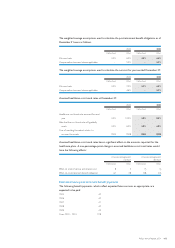
The weighted average assumptions used to calculate the postretirement benefit obligations as of
December 31 were as follows:
2003 2004
Netherlands Other Netherlands Other
Discount rate 5.3% 6.5% 4.5% 6.6%
Compensation increase (where applicable) – 5.3% – 5.3%
The weighted average assumptions used to calculate the net cost for years ended December 31:
2003 2004
Netherlands Other Netherlands Other
Discount rate 5.5% 7.0% 5.3% 6.5%
Compensation increase (where applicable) – 4.6% – 5.3%
Assumed healthcare cost trend rates at December 31:
2003 2004
Netherlands Other Netherlands Other
Healthcare cost trend rate assumed for next
year 5.0% 10.0% 5.0% 8.5%
Rate that the cost trend rate will gradually
reach 5.0% 6.0% 5.0% 6.0%
Year of reaching the rate at which it is
assumed to remain 2004 2008 2005 2008
Assumed healthcare cost trend rates have a significant effect on the amounts reported for the
healthcare plans. A one-percentage-point change in assumed healthcare cost trend rates would
have the following effects:
One-percentage-point
increase
One-percentage-point
decrease
Netherlands Other Netherlands Other
Effect on total of service and interest cost 8 3 (7) (2)
Effect on postretirement benefit obligation 61 28 (48) (24)
Estimated future postretirement benefit payments
The following benefit payments, which reflect expected future service, as appropriate, are
expected to be paid:
2005 40
2006 40
2007 41
2008 42
2009 43
Years 2010 – 2014 228
145Philips Annual Report 2004