Philips 2004 Annual Report Download - page 133
Download and view the complete annual report
Please find page 133 of the 2004 Philips annual report below. You can navigate through the pages in the report by either clicking on the pages listed below, or by using the keyword search tool below to find specific information within the annual report.-
 1
1 -
2
-
3
-
4
-
5
-
6
-
7
-
8
-
9
-
10
-
11
-
12
-
13
-
14
-
15
-
16
-
17
-
18
-
19
-
20
-
21
-
22
-
23
-
24
-
25
-
26
-
27
-
28
-
29
-
30
-
31
-
32
-
33
-
34
-
35
-
36
-
37
-
38
-
39
-
40
-
41
-
42
-
43
-
44
-
45
-
46
-
47
-
48
-
49
-
50
-
51
-
52
-
53
-
54
-
55
-
56
-
57
-
58
-
59
-
60
-
61
-
62
-
63
-
64
-
65
-
66
-
67
-
68
-
69
-
70
-
71
-
72
-
73
-
74
-
75
-
76
-
77
-
78
-
79
-
80
-
81
-
82
-
83
-
84
-
85
-
86
-
87
-
88
-
89
-
90
-
91
-
92
-
93
-
94
-
95
-
96
-
97
-
98
-
99
-
100
-
101
-
102
-
103
-
104
-
105
-
106
-
107
-
108
-
109
-
110
-
111
-
112
-
113
-
114
-
115
-
116
-
117
-
118
-
119
-
120
-
121
-
122
-
 123
123 -
 124
124 -
 125
125 -
 126
126 -
 127
127 -
 128
128 -
 129
129 -
 130
130 -
 131
131 -
 132
132 -
 133
133 -
 134
134 -
 135
135 -
 136
136 -
 137
137 -
 138
138 -
 139
139 -
 140
140 -
 141
141 -
 142
142 -
 143
143 -
144
-
145
-
146
-
147
-
148
-
149
-
150
-
151
-
152
-
153
-
154
-
155
-
156
-
157
-
158
-
159
-
160
-
161
-
162
-
163
-
164
-
165
-
166
-
167
-
168
-
169
-
170
-
171
-
172
-
173
-
174
-
175
-
176
-
177
-
178
-
179
-
180
-
181
-
182
-
183
-
184
-
185
-
186
-
187
-
188
-
189
-
190
-
191
-
192
-
193
-
194
-
195
-
196
-
197
-
198
-
199
-
200
-
201
-
202
-
203
-
204
-
205
-
206
-
207
-
208
-
209
-
210
-
211
-
212
-
213
-
214
-
215
-
216
-
217
-
218
-
219
 |
 |

O
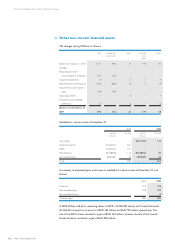
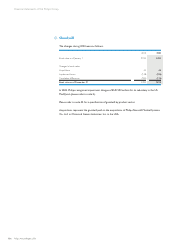
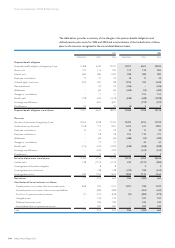
12 Other non-current financial assets
The changes during 2004 are as follows:
total available-for-
sale securities
loans restricted
liquid
assets
other
Balance as of January 1, 2004 1,213 982 31 140 60
Changes:
Reclassification from
unconsolidated companies 364 364 – – –
Acquisitions/additions 8 – 3 1 4
Sales/redemptions/reductions (903) (883) (9) (7) (4)
Adjustments to fair market
value 199 199 – – –
Value adjustments – – (1) – 1
Translation and exchange
differences (5)– (2)– (3)
Balance as of December 31,
2004 876 662 22 134 58
Available-for-sale securities at December 31:
2003 2004
number
of shares
fair value number
of shares
fair value
Atos Origin – – 10,321,043 516
Vivendi Universal 32,265,561 622 ––
ASML 13,440,000 211 ––
JDS Uniphase 39,318,996 114 39,318,996 92
GN Great Nordic 6,830,687 35 6,830,687 54
Total 982 662
A summary of unrealized gains and losses on available-for-sale securities at December 31 is as
follows:
2003 2004
Total cost 554 476
Net unrealized gains 428 187
Net unrealized losses –(1)
Total fair value 982 662
In 2004, Philips sold all its remaining shares in ASML (13,440,000 shares) and Vivendi Universal
(32,265,561 shares) for an amount of EUR 163 million and EUR 720 million respectively. The
sale of the ASML shares resulted in a gain of EUR 140 million, whereas the sale of the Vivendi
Universal shares resulted in a gain of EUR 300 million.
132 Philips Annual Report 2004
Financial statements of the Philips Group