Philips 2004 Annual Report Download - page 142
Download and view the complete annual report
Please find page 142 of the 2004 Philips annual report below. You can navigate through the pages in the report by either clicking on the pages listed below, or by using the keyword search tool below to find specific information within the annual report.-
 1
1 -
2
-
3
-
4
-
5
-
6
-
7
-
8
-
9
-
10
-
11
-
12
-
13
-
14
-
15
-
16
-
17
-
18
-
19
-
20
-
21
-
22
-
23
-
24
-
25
-
26
-
27
-
28
-
29
-
30
-
31
-
32
-
33
-
34
-
35
-
36
-
37
-
38
-
39
-
40
-
41
-
42
-
43
-
44
-
45
-
46
-
47
-
48
-
49
-
50
-
51
-
52
-
53
-
54
-
55
-
56
-
57
-
58
-
59
-
60
-
61
-
62
-
63
-
64
-
65
-
66
-
67
-
68
-
69
-
70
-
71
-
72
-
73
-
74
-
75
-
76
-
77
-
78
-
79
-
80
-
81
-
82
-
83
-
84
-
85
-
86
-
87
-
88
-
89
-
90
-
91
-
92
-
93
-
94
-
95
-
96
-
97
-
98
-
99
-
100
-
101
-
102
-
103
-
104
-
105
-
106
-
107
-
108
-
109
-
110
-
111
-
112
-
113
-
114
-
115
-
116
-
117
-
118
-
119
-
120
-
121
-
122
-
123
-
124
-
125
-
126
-
127
-
128
-
129
-
130
-
131
-
 132
132 -
 133
133 -
 134
134 -
 135
135 -
 136
136 -
 137
137 -
 138
138 -
 139
139 -
 140
140 -
 141
141 -
 142
142 -
 143
143 -
 144
144 -
 145
145 -
 146
146 -
 147
147 -
 148
148 -
 149
149 -
 150
150 -
 151
151 -
 152
152 -
153
-
154
-
155
-
156
-
157
-
158
-
159
-
160
-
161
-
162
-
163
-
164
-
165
-
166
-
167
-
168
-
169
-
170
-
171
-
172
-
173
-
174
-
175
-
176
-
177
-
178
-
179
-
180
-
181
-
182
-
183
-
184
-
185
-
186
-
187
-
188
-
189
-
190
-
191
-
192
-
193
-
194
-
195
-
196
-
197
-
198
-
199
-
200
-
201
-
202
-
203
-
204
-
205
-
206
-
207
-
208
-
209
-
210
-
211
-
212
-
213
-
214
-
215
-
216
-
217
-
218
-
219
 |
 |

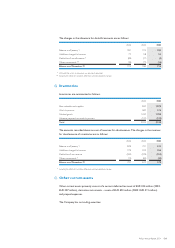
2002 2003 2004
Increase in minimum liability,
included in other comprehensive income
– (before income taxes) 514 13 118
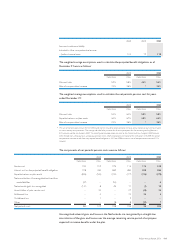
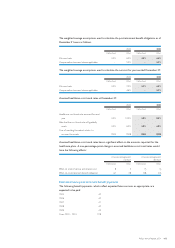
The weighted average assumptions used to calculate the projected benefit obligations as of
December 31 were as follows:
2003 2004
Netherlands Other Netherlands Other
Discount rate 5.3% 5.8% 4.5% 5.4%
Rate of compensation increase 2.0% 3.6% * 3.5%
The weighted-average assumptions used to calculate the net periodic pension cost for years
ended December 31:
2003 2004
Netherlands Other Netherlands Other
Discount rate 5.5% 6.2% 5.3% 5.8%
Expected returns on plan assets 6.0% 6.7% 6.0% 6.5%
Rate of compensation increase 2.5% 3.6% * 3.6%
*The rate of compensaton increase for the Netherlands consists of a general compensation increase and an individual salary increase based
on merit, seniority and promotion. The average individual salary increase for all active participants for the remaining working lifetime is
0.9% annually and did not change in 2004. The rate of general compensation increase for the Netherlands has changed in 2004 because
of the change from a final-pay to an average-pay pension system which incorporates a limitation of the indexation. Until 2008 the rate of
compensation increase to calculate the projected benefit obligation is 2%. From 2008 onwards a rate of compensation increase of 1% is
included.
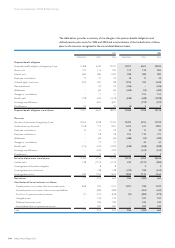
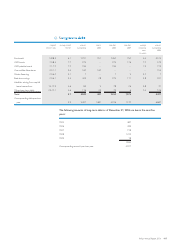
The components of net periodic pension costs were as follows:
2002 2003 2004
Netherlands Other Netherlands Other Netherlands Other
Service cost 234 153 229 116 175 128
Interest cost on the projected benefit obligation 728 430 683 384 598 386
Expected return on plan assets (836) (505) (700) (377) (726) (370)
Net amortization of unrecognized net transition
assets/liabilities (67) – (55) – –5
Net actuarial (gain) loss recognized (141) 8 49 11 (1) 19
Amortization of prior service cost – 32 – 27 (43) 26
Settlement loss – 4 – 24 34 3
Curtailment loss – 1 – 3 ––
Other – – (8)8(12)7
Net periodic cost (82) 123 198 196 25 204
Unrecognized actuarial gains and losses in the Netherlands are recognized by a straight-line
amortization of the gains and losses over the average remaining service period of employees
expected to receive benefits under the plan.
141Philips Annual Report 2004