Philips 2004 Annual Report Download - page 71
Download and view the complete annual report
Please find page 71 of the 2004 Philips annual report below. You can navigate through the pages in the report by either clicking on the pages listed below, or by using the keyword search tool below to find specific information within the annual report.-
 1
1 -
2
-
3
-
4
-
5
-
6
-
7
-
8
-
9
-
10
-
11
-
12
-
13
-
14
-
15
-
16
-
17
-
18
-
19
-
20
-
21
-
22
-
23
-
24
-
25
-
26
-
27
-
28
-
29
-
30
-
31
-
32
-
33
-
34
-
35
-
36
-
37
-
38
-
39
-
40
-
41
-
42
-
43
-
44
-
45
-
46
-
47
-
48
-
49
-
50
-
51
-
52
-
53
-
54
-
55
-
56
-
57
-
58
-
59
-
60
-
 61
61 -
 62
62 -
 63
63 -
 64
64 -
 65
65 -
 66
66 -
 67
67 -
 68
68 -
 69
69 -
 70
70 -
 71
71 -
 72
72 -
 73
73 -
 74
74 -
 75
75 -
 76
76 -
 77
77 -
 78
78 -
 79
79 -
 80
80 -
 81
81 -
82
-
83
-
84
-
85
-
86
-
87
-
88
-
89
-
90
-
91
-
92
-
93
-
94
-
95
-
96
-
97
-
98
-
99
-
100
-
101
-
102
-
103
-
104
-
105
-
106
-
107
-
108
-
109
-
110
-
111
-
112
-
113
-
114
-
115
-
116
-
117
-
118
-
119
-
120
-
121
-
122
-
123
-
124
-
125
-
126
-
127
-
128
-
129
-
130
-
131
-
132
-
133
-
134
-
135
-
136
-
137
-
138
-
139
-
140
-
141
-
142
-
143
-
144
-
145
-
146
-
147
-
148
-
149
-
150
-
151
-
152
-
153
-
154
-
155
-
156
-
157
-
158
-
159
-
160
-
161
-
162
-
163
-
164
-
165
-
166
-
167
-
168
-
169
-
170
-
171
-
172
-
173
-
174
-
175
-
176
-
177
-
178
-
179
-
180
-
181
-
182
-
183
-
184
-
185
-
186
-
187
-
188
-
189
-
190
-
191
-
192
-
193
-
194
-
195
-
196
-
197
-
198
-
199
-
200
-
201
-
202
-
203
-
204
-
205
-
206
-
207
-
208
-
209
-
210
-
211
-
212
-
213
-
214
-
215
-
216
-
217
-
218
-
219
 |
 |

Liquidity and capital resources
Cash flows
Condensed consolidated statements of cash flows for the years
ended December 31, 2004, 2003 and 2002 are presented below:
Condensed cash flow statement
2002 2003 2004
Cash flows from operating activities:
Net income (loss) (3,206) 695 2,836
Adjustments to reconcile net
income to net cash provided by
operating activities 5,434 1,297 (139)
Net cash provided by operating
activities 2,228 1,992 2,697
Net cash (used for) provided by
investing activities (248) 742 653
Cash flows before financing activities 1,980 2,734 3,350
Net cash used for financing activities (897) (1,355) (2,145)
Cash provided by continuing
operations 1,083 1,379 1,205
Effect of changes in consolidation on
cash positions – – 117
Effect of changes in exchange rates
on cash positions (115) (165) (45)
Cash and cash equivalents
at beginning of year 890 1,858 3,072
Cash and cash equivalents at end of
year 1,858 3,072 4,349
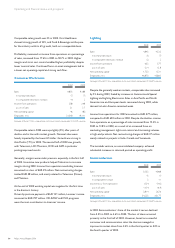
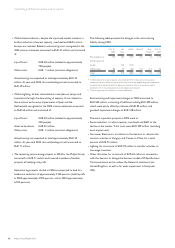
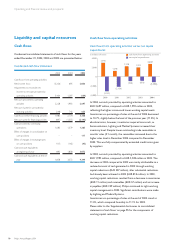
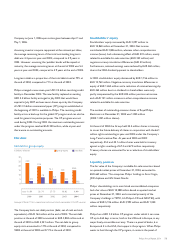
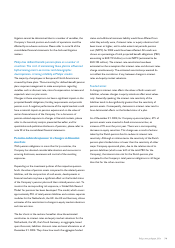
Cash flow from operating activities
Cash flows from operating activities versus net capital
expenditures
4,000
2,000
0
(2,000)
(4,000)
in millions of euros cash flows from operating activities
net capital expenditures
(3,132)
(2,156)
(856)
(940)
20042003200220012000
2,996
1,248
1,992
2,228
2,697
(1,198)
In 2004, net cash provided by operating activities amounted to
EUR 2,697 million, compared to EUR 1,992 million in 2003,
reflecting the higher income and lower working capital needs.
Inventories as a percentage of sales at the end of 2004 decreased
to 10.7%, slightly below the level of the previous year (11.0%). In
absolute terms, however, inventories required more cash, as
Semiconductors, Lighting and Medical Systems increased their
inventory level. Despite lower outstanding trade receivables in
months’ sales (0.1 month), the receivables increased due to the
higher sales level in December 2004 compared to December
2003. This was fully compensated by extended credit terms given
by suppliers.
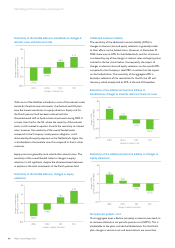
In 2003, net cash provided by operating activities amounted to
EUR 1,992 million, compared to EUR 2,228 million in 2002. The
decrease in 2003 compared to 2002 was mainly attributable to a
reduced amount of cash generated in 2003 through working
capital reductions (EUR 307 million), after substantial reductions
had already been achieved in 2002 (EUR 815 million). In 2003,
working capital reductions resulted from a decrease in inventories
(EUR 11 million) and receivables (EUR 57 million) and an increase
in payables (EUR 239 million). Philips continued its tight working
capital management in 2003. Significant contributions were made
by Lighting and Medical Systems.
Inventories as a percentage of sales at the end of 2003 stood at
11.0%, which compared favorably to 11.1% for 2002.
Please refer to the ‘Supplemental disclosures to consolidated
statements of cash flows’ on page 95 for the components of
working capital reductions.
70 Philips Annual Report 2004
Operating and financial review and prospects