Philips 2004 Annual Report Download - page 55
Download and view the complete annual report
Please find page 55 of the 2004 Philips annual report below. You can navigate through the pages in the report by either clicking on the pages listed below, or by using the keyword search tool below to find specific information within the annual report.-
 1
1 -
2
-
3
-
4
-
5
-
6
-
7
-
8
-
9
-
10
-
11
-
12
-
13
-
14
-
15
-
16
-
17
-
18
-
19
-
20
-
21
-
22
-
23
-
24
-
25
-
26
-
27
-
28
-
29
-
30
-
31
-
32
-
33
-
34
-
35
-
36
-
37
-
38
-
39
-
40
-
41
-
42
-
43
-
44
-
 45
45 -
 46
46 -
 47
47 -
 48
48 -
 49
49 -
 50
50 -
 51
51 -
 52
52 -
 53
53 -
 54
54 -
 55
55 -
 56
56 -
 57
57 -
 58
58 -
 59
59 -
 60
60 -
 61
61 -
 62
62 -
 63
63 -
 64
64 -
 65
65 -
66
-
67
-
68
-
69
-
70
-
71
-
72
-
73
-
74
-
75
-
76
-
77
-
78
-
79
-
80
-
81
-
82
-
83
-
84
-
85
-
86
-
87
-
88
-
89
-
90
-
91
-
92
-
93
-
94
-
95
-
96
-
97
-
98
-
99
-
100
-
101
-
102
-
103
-
104
-
105
-
106
-
107
-
108
-
109
-
110
-
111
-
112
-
113
-
114
-
115
-
116
-
117
-
118
-
119
-
120
-
121
-
122
-
123
-
124
-
125
-
126
-
127
-
128
-
129
-
130
-
131
-
132
-
133
-
134
-
135
-
136
-
137
-
138
-
139
-
140
-
141
-
142
-
143
-
144
-
145
-
146
-
147
-
148
-
149
-
150
-
151
-
152
-
153
-
154
-
155
-
156
-
157
-
158
-
159
-
160
-
161
-
162
-
163
-
164
-
165
-
166
-
167
-
168
-
169
-
170
-
171
-
172
-
173
-
174
-
175
-
176
-
177
-
178
-
179
-
180
-
181
-
182
-
183
-
184
-
185
-
186
-
187
-
188
-
189
-
190
-
191
-
192
-
193
-
194
-
195
-
196
-
197
-
198
-
199
-
200
-
201
-
202
-
203
-
204
-
205
-
206
-
207
-
208
-
209
-
210
-
211
-
212
-
213
-
214
-
215
-
216
-
217
-
218
-
219
 |
 |

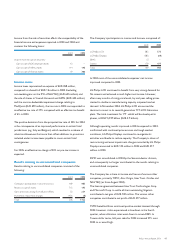
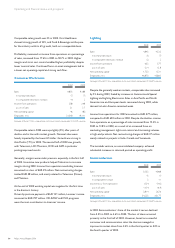
Lighting
Key data
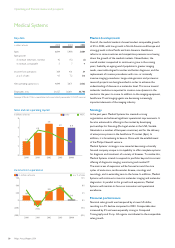
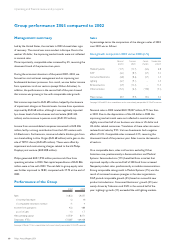
in millions of euros 2002 2003 2004
Sales 4,845 4,522 4,526
Sales growth
% (decrease), nominal (5) (7) 0
% (decrease) increase, comparable (2) 2 5
Income from operations 602 577 591
asa%ofsales 12.4 12.8 13.1
Net operating capital (NOC) 1,723 1,521 1,493
Employees (FTEs) 46,870 43,800 44,004
See pages 210 and 211 for a reconciliation to the most directly comparable US GAAP measures.
Sales and net operating capital
4.5
4.8
5.1
5.1
6
4
2
0
in billions of euros sales NOC
20042003200220012000
4.5
Income from operations
800
600
400
200
0
18%
16%
14%
12%
10%
20042003200220012000
in millions of euros as a % of sales
577
602
582
668
591
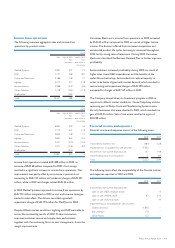
Market developments
The lighting market recovered well in 2004, although weak
demand in the European construction sector impacted local
Luminaires sales. Mature markets such as lamps and lighting
electronics picked up strongly, and new emerging markets like
UHP, automotive and LEDs continued to develop rapidly. In
regional terms, Asia Pacific continued to be the main area of
growth.
Strategy
Lighting wants to achieve profitable growth – in the fast-growing
economies (especially China), with leading global customers, in
innovative new market segments and by enhancing the position in
the value chain towards professional customers and end-users.
End-user-driven innovation, marketing and supply excellence, and
people are the key drivers for the business as it moves forward.
Lighting will continue to pursue a policy of continuous
improvement and strict control of costs and assets.
It also seeks to develop in new areas, expanding its leading position
in lighting systems into fast-growing consumer electronics
applications like video-projection systems, as well as developing its
solid-state lighting (LED) activities. Lumileds Lighting, an
unconsolidated venture with Agilent Technologies in which Philips
holds a 48% stake, achieved a substantial increase in sales and
income, whilst continuing to build its product portfolio for the
future. For its fiscal year Lumileds Lighting’s sales were USD
280 million, representing 44% growth compared to the prior fiscal
year. During the fiscal year 2004 net income tripled to
USD 62 million compared to the previous year.
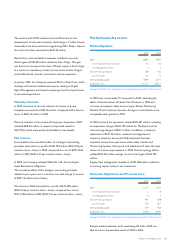
Financial performance
Nominal sales remained flat and were heavily impacted by the
sliding US dollar. Benefiting from the market recovery, comparable
sales increased by 5%, mainly driven by high growth in Automotive,
Special Lighting & UHP and Lighting Electronics. Sales in Europe
and Asia Pacific were particularly buoyant, with North America
recovering steadily. Income from operations increased from
EUR 577 million in 2003 to EUR 591 million. As a percentage of
sales, income from operations continued the upward trend shown
in the previous years, going from 12.4% in 2002 to 12.8% in 2003
and 13.1% in 2004. Restructuring and impairment charges in 2004
totaled EUR 63 million, mainly for Lamps and Luminaires,
compared with EUR 27 million in 2003.
54 Philips Annual Report 2004
Operating and financial review and prospects