Philips 2004 Annual Report Download - page 72
Download and view the complete annual report
Please find page 72 of the 2004 Philips annual report below. You can navigate through the pages in the report by either clicking on the pages listed below, or by using the keyword search tool below to find specific information within the annual report.-
 1
1 -
2
-
3
-
4
-
5
-
6
-
7
-
8
-
9
-
10
-
11
-
12
-
13
-
14
-
15
-
16
-
17
-
18
-
19
-
20
-
21
-
22
-
23
-
24
-
25
-
26
-
27
-
28
-
29
-
30
-
31
-
32
-
33
-
34
-
35
-
36
-
37
-
38
-
39
-
40
-
41
-
42
-
43
-
44
-
45
-
46
-
47
-
48
-
49
-
50
-
51
-
52
-
53
-
54
-
55
-
56
-
57
-
58
-
59
-
60
-
61
-
 62
62 -
 63
63 -
 64
64 -
 65
65 -
 66
66 -
 67
67 -
 68
68 -
 69
69 -
 70
70 -
 71
71 -
 72
72 -
 73
73 -
 74
74 -
 75
75 -
 76
76 -
 77
77 -
 78
78 -
 79
79 -
 80
80 -
 81
81 -
 82
82 -
83
-
84
-
85
-
86
-
87
-
88
-
89
-
90
-
91
-
92
-
93
-
94
-
95
-
96
-
97
-
98
-
99
-
100
-
101
-
102
-
103
-
104
-
105
-
106
-
107
-
108
-
109
-
110
-
111
-
112
-
113
-
114
-
115
-
116
-
117
-
118
-
119
-
120
-
121
-
122
-
123
-
124
-
125
-
126
-
127
-
128
-
129
-
130
-
131
-
132
-
133
-
134
-
135
-
136
-
137
-
138
-
139
-
140
-
141
-
142
-
143
-
144
-
145
-
146
-
147
-
148
-
149
-
150
-
151
-
152
-
153
-
154
-
155
-
156
-
157
-
158
-
159
-
160
-
161
-
162
-
163
-
164
-
165
-
166
-
167
-
168
-
169
-
170
-
171
-
172
-
173
-
174
-
175
-
176
-
177
-
178
-
179
-
180
-
181
-
182
-
183
-
184
-
185
-
186
-
187
-
188
-
189
-
190
-
191
-
192
-
193
-
194
-
195
-
196
-
197
-
198
-
199
-
200
-
201
-
202
-
203
-
204
-
205
-
206
-
207
-
208
-
209
-
210
-
211
-
212
-
213
-
214
-
215
-
216
-
217
-
218
-
219
 |
 |

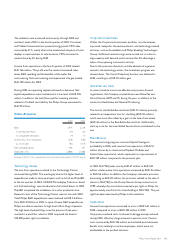
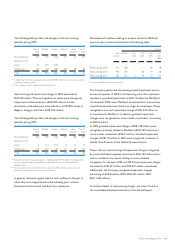
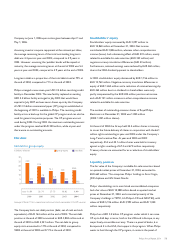
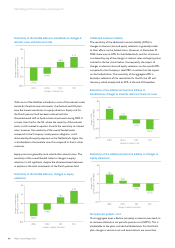
Cash flow from investing activities
Cash flows from divestments and acquisitions
5,000
2,500
0
(2,500)
(5,000)
in millions of euros
4,497
(3,769)
1,305
(3,713)
2,086
(488)
1,333
(641)
divestments*
* Including cash proceeds from currency swap transactions
acquisitions
20042003200220012000
2,302
(451)
Net cash provided by investing activities in 2004 of EUR 653
million (2003: EUR 742 million) mainly consisted of:
GNet capital expenditures of EUR 1,198 million, EUR 342 million
above the level of 2003, primarily at Semiconductors. Net capital
expenditures at Semiconductors amounted to EUR 573 million,
primarily related to Systems on Silicon Manufacturing Company
(SSMC) (EUR 216 million), which was consolidated for the first
time in 2004, and to investments to balance capacity.
GAcquisitions totaling EUR 451 million, mainly consisting of an
equity contribution to LG.Philips Displays (EUR 202 million) and
investments in Crolles2 (EUR 105 million), the Philips-Neusoft
Medical Systems venture and Gemini (CE investment in the USA).
GCash proceeds of EUR 2,302 million, mainly relating to the
NAVTEQ IPO (EUR 672 million), the sale of part of our
investment in Atos Origin (EUR 552 million) and the sale of
shares in Vivendi Universal (EUR 720 million) and ASML
(EUR 163 million). In addition, there was a cash receipt of
EUR 125 million for maturing currency hedges.
In 2003, net cash provided by investing activities amounted to
EUR 742 million. In 2002, net cash used for investing activities
amounted to EUR 248 million. In 2003, the Company received
EUR 908 million from the sale of 100 million American Depository
Shares (ADS) and EUR 357 million from the redemption of
preference shares by TSMC. Additionally, proceeds from the sale
of shares of Vivendi Universal, ASML and JDS Uniphase amounting
to EUR 272 million were received. Furthermore, EUR 391 million
was received due to the resetting of currency swaps.
In 2003, gross capital expenditures were held to a low level, similar
to 2002.
During 2003, EUR 470 million was used for investments in
business interests, the most significant of which were a 49.5%
investment in InterTrust (EUR 202 million), an expansion of the
investment in Crolles2 (EUR 99 million) and a loan to the
Company’s Lumileds venture (EUR 54 million).
During the year 2002, EUR 626 million was used for the purchase
of businesses and investments in unconsolidated companies. An
amount of EUR 250 million was used for a settlement associated
with the establishment of the joint venture LG.Philips Displays,
including a subsequent cash injection. Additionally, a final payment
of EUR 90 million was made to Agilent in respect of the 2001
acquisition of HSG. A capital injection in SSMC was made for an
amount of EUR 69 million, and a number of smaller investments
were also made. These outflows were offset by proceeds from the
sale of various businesses in 2002 totaling EUR 813 million,
primarily the sale of Philips Contract Manufacturing Services, X-ray
Analytical, Communication, Security and Imaging, the HCP group
of Medical Systems, Philips Broadband Networks and
TechnoFusion. Furthermore, the final instalment of EUR 63 million
on the 2001 sale of Philips Broadcast was collected. In addition,
EUR 422 million was received from the resetting of currency swap
transactions, while proceeds from the sale of shares (of which
ASML shares of EUR 72 million) amounted to EUR 98 million.
As a result of the items mentioned above, cash flows before
financing activities were positive EUR 3,350 million in 2004,
EUR 2,734 million in 2003 and EUR 1,980 million in 2002.
Cash flow from financing activities
Net cash used for financing activities in 2004 amounted to
EUR 2,145 million. During the year Philips repaid EUR 1,227
million of maturing bonds and repurchased EUR 300 million of
notes that otherwise would have matured on August 30, 2005.
Additionally, Philips’ shareholders were paid EUR 460 million in
dividend. Treasury stock transactions led to a cash outflow of
EUR 18 million. Cash outflow for shares acquired (EUR 96 million)
was partly offset by cash inflow due to the exercise of stock
options (EUR 78 million).
In 2003, net cash used for financing activities amounted to
EUR 1,355 million. This included a EUR 944 million reduction of
debt, primarily due to a one-year-early redemption of a EUR 1,000
million floating rate note and a EUR 139 million repayment of
maturing bonds. In 2003, Philips entered into a USD 151 million
7-year floating unsecured bullet loan from the EIB (European
Investment Bank) and a USD 100 million syndicated loan in the
Philippines. Philips’ shareholders were paid a distribution in cash
totaling EUR 460 million. Treasury stock transactions led to a cash
inflow of EUR 49 million, consisting of cash inflow for the exercise
71Philips Annual Report 2004