Philips 2004 Annual Report Download - page 63
Download and view the complete annual report
Please find page 63 of the 2004 Philips annual report below. You can navigate through the pages in the report by either clicking on the pages listed below, or by using the keyword search tool below to find specific information within the annual report.-
 1
1 -
2
-
3
-
4
-
5
-
6
-
7
-
8
-
9
-
10
-
11
-
12
-
13
-
14
-
15
-
16
-
17
-
18
-
19
-
20
-
21
-
22
-
23
-
24
-
25
-
26
-
27
-
28
-
29
-
30
-
31
-
32
-
33
-
34
-
35
-
36
-
37
-
38
-
39
-
40
-
41
-
42
-
43
-
44
-
45
-
46
-
47
-
48
-
49
-
50
-
51
-
52
-
 53
53 -
 54
54 -
 55
55 -
 56
56 -
 57
57 -
 58
58 -
 59
59 -
 60
60 -
 61
61 -
 62
62 -
 63
63 -
 64
64 -
 65
65 -
 66
66 -
 67
67 -
 68
68 -
 69
69 -
 70
70 -
 71
71 -
 72
72 -
 73
73 -
74
-
75
-
76
-
77
-
78
-
79
-
80
-
81
-
82
-
83
-
84
-
85
-
86
-
87
-
88
-
89
-
90
-
91
-
92
-
93
-
94
-
95
-
96
-
97
-
98
-
99
-
100
-
101
-
102
-
103
-
104
-
105
-
106
-
107
-
108
-
109
-
110
-
111
-
112
-
113
-
114
-
115
-
116
-
117
-
118
-
119
-
120
-
121
-
122
-
123
-
124
-
125
-
126
-
127
-
128
-
129
-
130
-
131
-
132
-
133
-
134
-
135
-
136
-
137
-
138
-
139
-
140
-
141
-
142
-
143
-
144
-
145
-
146
-
147
-
148
-
149
-
150
-
151
-
152
-
153
-
154
-
155
-
156
-
157
-
158
-
159
-
160
-
161
-
162
-
163
-
164
-
165
-
166
-
167
-
168
-
169
-
170
-
171
-
172
-
173
-
174
-
175
-
176
-
177
-
178
-
179
-
180
-
181
-
182
-
183
-
184
-
185
-
186
-
187
-
188
-
189
-
190
-
191
-
192
-
193
-
194
-
195
-
196
-
197
-
198
-
199
-
200
-
201
-
202
-
203
-
204
-
205
-
206
-
207
-
208
-
209
-
210
-
211
-
212
-
213
-
214
-
215
-
216
-
217
-
218
-
219
 |
 |

Excluding the effect of the non-cash impairment losses recorded
on security investments, financial income and expenses decreased
in 2003 by EUR 28 million compared to 2002. Net interest
expense in 2003 amounted to EUR 328 million, a decrease of
EUR 56 million from 2002. The decrease was primarily attributable
to a reduction in average net debt outstanding.
Income from non-current financial assets amounted to EUR 148
million in 2003 and was the result from the sale of shares in ASML,
Vivendi Universal and JDS Uniphase. In 2002, a EUR 67 million gain
on the sale of ASML shares was recorded.
Other financial income and expenses in 2003 represented a loss of
EUR 64 million, mainly caused by an IT deficiency in an automated
currency-conversion system.
In 2003, no dividend was received on the Vivendi Universal shares,
while in 2002 EUR 33 million was received.
Income taxes
The income tax benefit totaled EUR 15 million in 2003, compared
with an expense of EUR 27 million in 2002.
Excluding non-tax-deductible impairment charges for MedQuist
and non-taxable gains on the sale of shares in JDS Uniphase, ASML
and Vivendi Universal, the tax benefit in 2003 corresponds to an
effective tax benefit of 6% compared with a projected effective tax
charge for 2003 of 25%. The positive deviation was the
consequence of an improved performance in certain fiscal
jurisdictions (amongst others NAVTEQ EUR 149 million), which
resulted in a release of valuation allowances that more than offset
additions to provisions to cover certain fiscal contingencies.
Excluding the non-deductible charges for impairment of securities,
the effective tax rate in 2002 would have amounted to 18%.
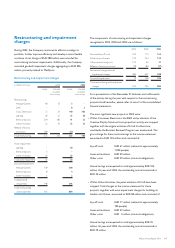
Results relating to unconsolidated companies
Results relating to unconsolidated companies consist of:
2002 2003
LG.Philips LCD 169 382
LG.Philips Displays (558) (796)
SSMC (54) (7)
Others (903)* 927**
Total (1,346) 506
*Includes Atos Origin’s impairment charges of EUR 921 million
** Includes EUR 695 million gain from sale of TSMC shares
Results relating to unconsolidated companies were influenced by
the following items which affect the comparability of the amounts
reported.
2002 2003
Impairment charges recorded by the Company (1,305) (431)
Restructuring and impairment charges recorded
by the unconsolidated company (301) (417)
Results on sale of shares 5 715
Equity non-operating dilution (losses) gains (12) 53
The operating results of most unconsolidated companies
improved in 2003 compared to 2002.
During the second half of 2003 the LCD industry witnessed
capacity shortages due to the explosive rise in demand. LG.Philips
LCD benefited from timely investment in new factories and
became the market leader in terms of both revenue and volume.
Average prices of LCD panels increased by over 35% during the
year. Philips’ 50% share in the LCD joint venture resulted in a
contribution to net income of EUR 382 million.
In 2003, LG.Philips Displays had to reorganize its activities to face
a tough and declining market. Largely due to the success of LCD
products, demand for products based on cathode ray tubes
(CRTs) is declining and the industry is facing structural
overcapacity.
Along with other major players, LG.Philips Displays reduced its
capacity and took restructuring and impairment charges of
EUR 417 million (Philips’ share).
In view of the deteriorated CRT market, the Company reassessed
the value of its investment in the CRT joint venture with LG
Electronics, which resulted in a further impairment charge of
EUR 411 million at year-end 2003.
Driven by increased demand in the second half of 2003, capacity
utilization at TSMC improved to 101% in the fourth quarter,
compared with 66% in 2002. The operating results of TSMC
almost doubled compared to 2002. The contribution to Philips’
net income included a gain on the sale of shares amounting to
EUR 695 million.
62 Philips Annual Report 2004
Operating and financial review and prospects