Philips 2004 Annual Report Download - page 159
Download and view the complete annual report
Please find page 159 of the 2004 Philips annual report below. You can navigate through the pages in the report by either clicking on the pages listed below, or by using the keyword search tool below to find specific information within the annual report.-
 1
1 -
2
-
3
-
4
-
5
-
6
-
7
-
8
-
9
-
10
-
11
-
12
-
13
-
14
-
15
-
16
-
17
-
18
-
19
-
20
-
21
-
22
-
23
-
24
-
25
-
26
-
27
-
28
-
29
-
30
-
31
-
32
-
33
-
34
-
35
-
36
-
37
-
38
-
39
-
40
-
41
-
42
-
43
-
44
-
45
-
46
-
47
-
48
-
49
-
50
-
51
-
52
-
53
-
54
-
55
-
56
-
57
-
58
-
59
-
60
-
61
-
62
-
63
-
64
-
65
-
66
-
67
-
68
-
69
-
70
-
71
-
72
-
73
-
74
-
75
-
76
-
77
-
78
-
79
-
80
-
81
-
82
-
83
-
84
-
85
-
86
-
87
-
88
-
89
-
90
-
91
-
92
-
93
-
94
-
95
-
96
-
97
-
98
-
99
-
100
-
101
-
102
-
103
-
104
-
105
-
106
-
107
-
108
-
109
-
110
-
111
-
112
-
113
-
114
-
115
-
116
-
117
-
118
-
119
-
120
-
121
-
122
-
123
-
124
-
125
-
126
-
127
-
128
-
129
-
130
-
131
-
132
-
133
-
134
-
135
-
136
-
137
-
138
-
139
-
140
-
141
-
142
-
143
-
144
-
145
-
146
-
147
-
148
-
 149
149 -
 150
150 -
 151
151 -
 152
152 -
 153
153 -
 154
154 -
 155
155 -
 156
156 -
 157
157 -
 158
158 -
 159
159 -
 160
160 -
 161
161 -
 162
162 -
 163
163 -
 164
164 -
 165
165 -
 166
166 -
 167
167 -
 168
168 -
 169
169 -
170
-
171
-
172
-
173
-
174
-
175
-
176
-
177
-
178
-
179
-
180
-
181
-
182
-
183
-
184
-
185
-
186
-
187
-
188
-
189
-
190
-
191
-
192
-
193
-
194
-
195
-
196
-
197
-
198
-
199
-
200
-
201
-
202
-
203
-
204
-
205
-
206
-
207
-
208
-
209
-
210
-
211
-
212
-
213
-
214
-
215
-
216
-
217
-
218
-
219
 |
 |

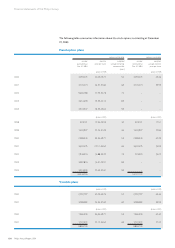
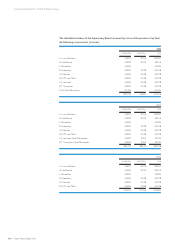
The following table summarizes information about the stock options outstanding at December
31, 2004:
Fixed option plans
options outstanding options exercisable
number
outstanding at
Dec. 31, 2004
exercise
price per share
weighted
average remaining
contractual life
(years)
number
exercisable at
Dec. 31, 2004
weighted
average exercise
price per share
(price in EUR) (price in EUR)
2000 3,059,475 42.03-53.75 5.2 3,059,475 43.46
2001 4,720,474 24.35-37.60 6.3 4,720,474 33.93
2002 9,465,188 17.19-34.78 7.2 – –
2003 3,612,618 15.29-22.12 8.3 – –
2004 3,503,947 18.39-25.62 9.3 – –
(price in USD) (price in USD)
1998 933,151 12.94-23.59 3.2 933,151 17.51
1999 1,450,937 22.24-31.09 4.4 1,450,937 22.96
2000 2,089,540 35.34-49.71 5.3 2,089,540 42.39
2001 3,650,575 22.12.-34.50 6.4 3,650,575 26.93
2002 7,946,524 16.88-30.70 7.3 223,020 26.22
2003 3,087,824 16.41-25.91 8.3 – –
2004 3,024,003 22.63-32.61 9.3 – –
46,544,256 16,127,172
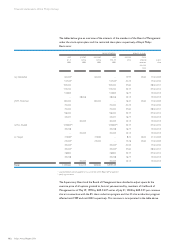
Variable plans
(price in EUR) (price in EUR)
2000 2,292,797 42.03-53.75 5.2 2,292,797 43.46
2001 3,289,082 24.35-37.60 6.2 3,289,082 33.93
(price in USD) (price in USD)
2000 1,565,529 36.65-49.71 5.3 1,565,529 42.40
2001 1,737,322 22.12-34.50 6.3 1,737,322 27.20
8,884,730 8,884,730
158 Philips Annual Report 2004
Financial statements of the Philips Group