Philips 2004 Annual Report Download - page 81
Download and view the complete annual report
Please find page 81 of the 2004 Philips annual report below. You can navigate through the pages in the report by either clicking on the pages listed below, or by using the keyword search tool below to find specific information within the annual report.-
 1
1 -
2
-
3
-
4
-
5
-
6
-
7
-
8
-
9
-
10
-
11
-
12
-
13
-
14
-
15
-
16
-
17
-
18
-
19
-
20
-
21
-
22
-
23
-
24
-
25
-
26
-
27
-
28
-
29
-
30
-
31
-
32
-
33
-
34
-
35
-
36
-
37
-
38
-
39
-
40
-
41
-
42
-
43
-
44
-
45
-
46
-
47
-
48
-
49
-
50
-
51
-
52
-
53
-
54
-
55
-
56
-
57
-
58
-
59
-
60
-
61
-
62
-
63
-
64
-
65
-
66
-
67
-
68
-
69
-
70
-
 71
71 -
 72
72 -
 73
73 -
 74
74 -
 75
75 -
 76
76 -
 77
77 -
 78
78 -
 79
79 -
 80
80 -
 81
81 -
 82
82 -
 83
83 -
 84
84 -
 85
85 -
 86
86 -
 87
87 -
 88
88 -
 89
89 -
 90
90 -
 91
91 -
92
-
93
-
94
-
95
-
96
-
97
-
98
-
99
-
100
-
101
-
102
-
103
-
104
-
105
-
106
-
107
-
108
-
109
-
110
-
111
-
112
-
113
-
114
-
115
-
116
-
117
-
118
-
119
-
120
-
121
-
122
-
123
-
124
-
125
-
126
-
127
-
128
-
129
-
130
-
131
-
132
-
133
-
134
-
135
-
136
-
137
-
138
-
139
-
140
-
141
-
142
-
143
-
144
-
145
-
146
-
147
-
148
-
149
-
150
-
151
-
152
-
153
-
154
-
155
-
156
-
157
-
158
-
159
-
160
-
161
-
162
-
163
-
164
-
165
-
166
-
167
-
168
-
169
-
170
-
171
-
172
-
173
-
174
-
175
-
176
-
177
-
178
-
179
-
180
-
181
-
182
-
183
-
184
-
185
-
186
-
187
-
188
-
189
-
190
-
191
-
192
-
193
-
194
-
195
-
196
-
197
-
198
-
199
-
200
-
201
-
202
-
203
-
204
-
205
-
206
-
207
-
208
-
209
-
210
-
211
-
212
-
213
-
214
-
215
-
216
-
217
-
218
-
219
 |
 |
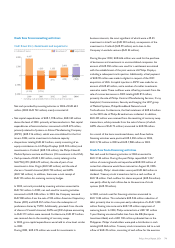
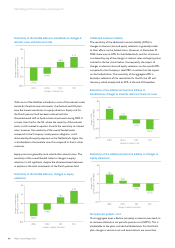
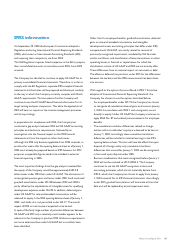
Sensitivity of the funded status to simultaneous changes in
interest rates and discount rates
1.0%0.5%(0.5%)(1.0%)
change in interest rate
change in funded status
(compared to total PBO)
10%
5%
0%
(5%)
(10%)
(7.2%)
(3.4%)
3.0%
5.7%
With most of the liabilities unfunded or most of the relevant assets
invested in fixed-income instruments, the German and UK plans
have the lowest sensitivities to equity valuations. Equity risk for
the Dutch pension fund has been reduced with the
aforementioned shift to fixed-income investments during 2004. It
is lower than that for the US, where the majority of the relevant
assets is still invested in equities. As with the sensitivity to interest
rates, however, the sensitivity of the overall funded status
compared to the Company’s total pension obligation, is still
dominated by the equity exposure in the Netherlands. Again, this
is attributable to the absolute size of it compared to that in other
countries.
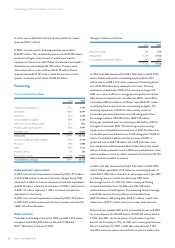
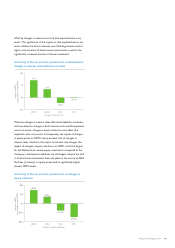
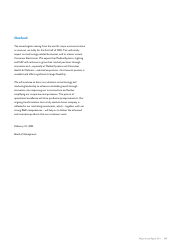
Equity prices are generally more volatile than interest rates. The
sensitivity of the overall funded status to changes in equity
valuations is still significant, despite the aforementioned decrease
in equities in the total investments of the Dutch pension fund.
Sensitivity of the funded status to changes in equity
valuations
20%10%(10%)(20%)
change in equity valuations
change in funded status
(compared to total PBO)
8%
4%
0%
(4%)
(8%)
(5.5%)
(2.8%)
2.8%
5.5%
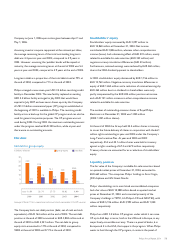
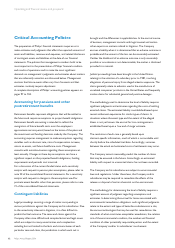
Additional minimum liability
The sensitivity of the additional minimum liability (AML) to
changes in interest rates and equity valuations is generally similar
to their effects on the funded status. However, at December 31,
2004, there was no AML for the Netherlands, and this situation is
not altered by any of the changes in interest rates and equity prices
included in the bar charts below. Consequently, the impact of
changes in interest rates and equity valuations on the overall AML
compared to the Company’s total PBO is smaller than the impact
on the funded status. The sensitivity of the aggregate AML is
basically a reflection of the sensitivities for the US, the UK and
Germany, which already had an AML at the end of December.
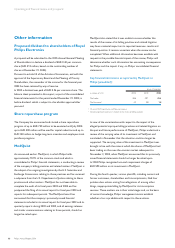
Sensitivity of the additional minimum liability to
simultaneous changes in interest rates and discount rates
1.0%0.5%(0.5%)(1.0%)
change in interest rate
change in AML
(compared to total PBO)
8%
4%
0%
(4%)
(8%)
(1.7%)
(4.3%)
4.6%
1.7%
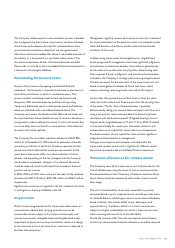
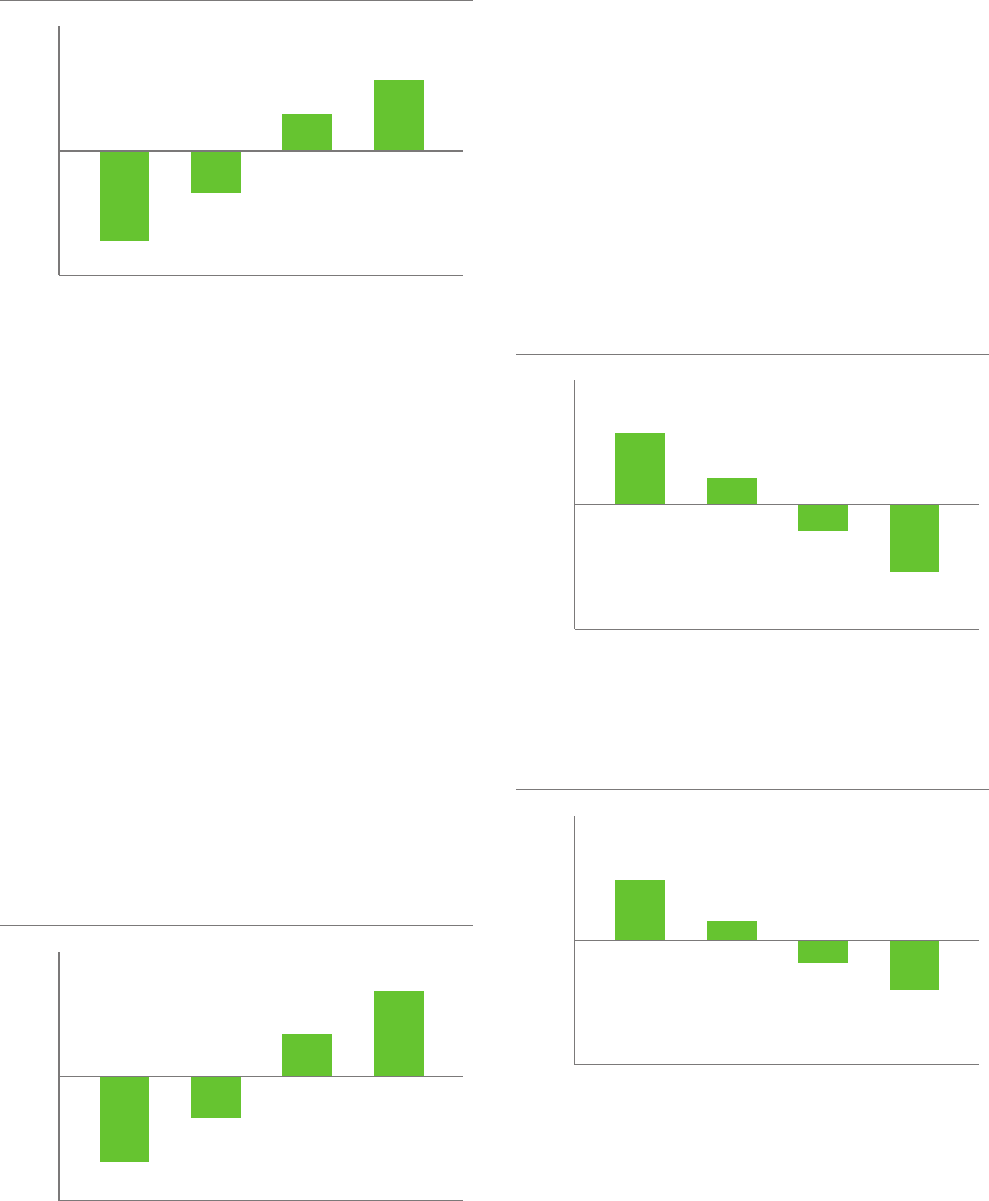
Sensitivity of the additional minimum liability to changes in
equity valuations
20%10%(10%)(20%)
change in equity valuations
change in AML
(compared to total PBO)
6%
3%
0%
(3%)
(6%)
(1.1%)
(2.2%)
2.8%
0.8%
Net periodic pension cost
On an aggregate level, a decline (increase) in interest rates leads to
an increase (decline) in net periodic pension cost (NPPC). This is
attributable to the plans outside the Netherlands. For the Dutch
plan, changes in service costs and amortizations are more than
80 Philips Annual Report 2004
Operating and financial review and prospects