Philips 2004 Annual Report Download - page 61
Download and view the complete annual report
Please find page 61 of the 2004 Philips annual report below. You can navigate through the pages in the report by either clicking on the pages listed below, or by using the keyword search tool below to find specific information within the annual report.-
 1
1 -
2
-
3
-
4
-
5
-
6
-
7
-
8
-
9
-
10
-
11
-
12
-
13
-
14
-
15
-
16
-
17
-
18
-
19
-
20
-
21
-
22
-
23
-
24
-
25
-
26
-
27
-
28
-
29
-
30
-
31
-
32
-
33
-
34
-
35
-
36
-
37
-
38
-
39
-
40
-
41
-
42
-
43
-
44
-
45
-
46
-
47
-
48
-
49
-
50
-
 51
51 -
 52
52 -
 53
53 -
 54
54 -
 55
55 -
 56
56 -
 57
57 -
 58
58 -
 59
59 -
 60
60 -
 61
61 -
 62
62 -
 63
63 -
 64
64 -
 65
65 -
 66
66 -
 67
67 -
 68
68 -
 69
69 -
 70
70 -
 71
71 -
72
-
73
-
74
-
75
-
76
-
77
-
78
-
79
-
80
-
81
-
82
-
83
-
84
-
85
-
86
-
87
-
88
-
89
-
90
-
91
-
92
-
93
-
94
-
95
-
96
-
97
-
98
-
99
-
100
-
101
-
102
-
103
-
104
-
105
-
106
-
107
-
108
-
109
-
110
-
111
-
112
-
113
-
114
-
115
-
116
-
117
-
118
-
119
-
120
-
121
-
122
-
123
-
124
-
125
-
126
-
127
-
128
-
129
-
130
-
131
-
132
-
133
-
134
-
135
-
136
-
137
-
138
-
139
-
140
-
141
-
142
-
143
-
144
-
145
-
146
-
147
-
148
-
149
-
150
-
151
-
152
-
153
-
154
-
155
-
156
-
157
-
158
-
159
-
160
-
161
-
162
-
163
-
164
-
165
-
166
-
167
-
168
-
169
-
170
-
171
-
172
-
173
-
174
-
175
-
176
-
177
-
178
-
179
-
180
-
181
-
182
-
183
-
184
-
185
-
186
-
187
-
188
-
189
-
190
-
191
-
192
-
193
-
194
-
195
-
196
-
197
-
198
-
199
-
200
-
201
-
202
-
203
-
204
-
205
-
206
-
207
-
208
-
209
-
210
-
211
-
212
-
213
-
214
-
215
-
216
-
217
-
218
-
219
 |
 |

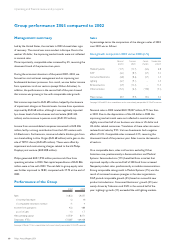
Group performance 2003 compared to 2002
Management summary
Led by the United States, the markets in 2003 showed clear signs
of recovery. The revival was more modest in Europe. Due to the
weaker US dollar, the improving market trends were not reflected
in nominal sales.
More importantly, comparable sales increased by 4%, reversing the
downward trend of the previous two years.
During the economic downturn of the period 2001–2003, we
focused on cost and asset management and on improving our
fundamental business processes. As a result, we saw better income
from operations in all our sectors (except Other Activities). In
addition, the performance in the second half of the year showed
that income was growing in line with comparable sales growth.
Net income improved to EUR 695 million, helped by the absence
of impairment charges on financial assets. Income from operations
improved by EUR 68 million, although it was negatively impacted
by a lower level of sold businesses and real estate (EUR 445
million) and an increase in pension costs (EUR 312 million).
Income from unconsolidated companies amounted to EUR 506
million, led by a strong contribution from the LCD venture with
LG Electronics. Furthermore, income included a dilution gain from
our shareholding in Atos Origin (EUR 68 million) and a gain on the
sale of TSMC shares (EUR 695 million). These were offset by
impairment and restructuring charges related to the LG.Philips
Displays joint venture (EUR 828 million).
Philips generated EUR 1,992 million positive cash flow from
operating activities in 2003. Net capital expenditures of EUR 856
million were in line with 2002. The net debt to group equity ratio
was further improved to 18:82, compared with 27:73 at the end of
2002.
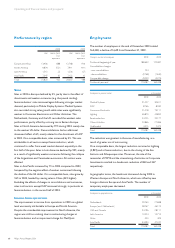
Performance of the Group
2002 2003
Sales 31,820 29,037
% nominal (decrease) (2) (9)
% comparable (decrease) increase (1) 4
Income from operations 420 488
asa%ofsales 1.3 1.7
Net operating capital 10,539 8,071
Employees (FTEs) 170,087 164,438
See pages 210 and 211 for a reconciliation to the most directly comparable US GAAP measures.
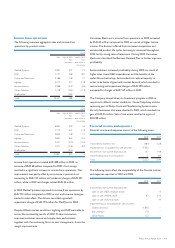
Sales
In percentage terms the composition of the change in sales of 2003
over 2002 was as follows:
Sales growth composition 2003 versus 2002 (in %)
Nominal
growth
Currency
effects
Consol.
changes
Comparable
growth
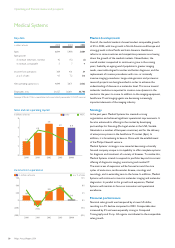
Medical Systems (12.5) (12.7) (6.6) 6.8
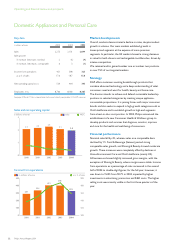
DAP (6.2) (8.7) (0.5) 3.0
Consumer Electronics (6.8) (8.6) (0.5) 2.3
Lighting (6.7) (9.1) – 2.4
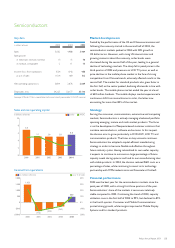
Semiconductors (0.9) (12.3) – 11.4
Other Activities (25.3) (6.3) (13.8) (5.2)
Philips Group (8.7) (9.9) (3.0) 4.2
See pages 210 and 211 for a reconciliation to the most directly comparable US GAAP measures.
Nominal sales in 2003 totaled EUR 29,037 million, 8.7% less than
in 2002. Due to the depreciation of the US dollar in 2003 the
improving market trends were not reflected in nominal sales:
slightly more than half of our business was done in US dollar and
US-dollar related currencies. Translation of these sales into euros
reduced total sales by 9.9%. Various divestments had a negative
effect of 3.0%. Comparable sales increased 4.2%, reversing the
downward trend of the previous year. Sales in euros decreased in
all sectors.
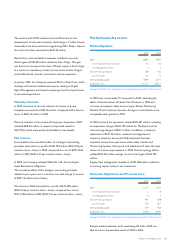
On a comparable basis, sales in all sectors excluding Other
Activities rose, predominantly in Semiconductors and Medical
Systems. Semiconductors (11%) benefited from a market that
improved rapidly in the second half of 2003 and from increased
Nexperia product sales, predominantly in mobile communications.
Strong comparable sales growth in Medical Systems (7%) was the
result of increased revenue synergies in the sales organization.
DAP posted comparable growth (3%) based on successful new
product introductions. Consumer Electronics’ growth (2%) was
mainly driven by Television and DVD in the second half of the
year. Lighting’s growth (2%) exceeded the soft lighting markets.
60 Philips Annual Report 2004
Operating and financial review and prospects