Philips 2004 Annual Report Download - page 5
Download and view the complete annual report
Please find page 5 of the 2004 Philips annual report below. You can navigate through the pages in the report by either clicking on the pages listed below, or by using the keyword search tool below to find specific information within the annual report.-
 1
1 -
 2
2 -
 3
3 -
 4
4 -
 5
5 -
 6
6 -
 7
7 -
 8
8 -
 9
9 -
 10
10 -
 11
11 -
 12
12 -
 13
13 -
 14
14 -
 15
15 -
 16
16 -
17
-
18
-
19
-
20
-
21
-
22
-
23
-
24
-
25
-
26
-
27
-
28
-
29
-
30
-
31
-
32
-
33
-
34
-
35
-
36
-
37
-
38
-
39
-
40
-
41
-
42
-
43
-
44
-
45
-
46
-
47
-
48
-
49
-
50
-
51
-
52
-
53
-
54
-
55
-
56
-
57
-
58
-
59
-
60
-
61
-
62
-
63
-
64
-
65
-
66
-
67
-
68
-
69
-
70
-
71
-
72
-
73
-
74
-
75
-
76
-
77
-
78
-
79
-
80
-
81
-
82
-
83
-
84
-
85
-
86
-
87
-
88
-
89
-
90
-
91
-
92
-
93
-
94
-
95
-
96
-
97
-
98
-
99
-
100
-
101
-
102
-
103
-
104
-
105
-
106
-
107
-
108
-
109
-
110
-
111
-
112
-
113
-
114
-
115
-
116
-
117
-
118
-
119
-
120
-
121
-
122
-
123
-
124
-
125
-
126
-
127
-
128
-
129
-
130
-
131
-
132
-
133
-
134
-
135
-
136
-
137
-
138
-
139
-
140
-
141
-
142
-
143
-
144
-
145
-
146
-
147
-
148
-
149
-
150
-
151
-
152
-
153
-
154
-
155
-
156
-
157
-
158
-
159
-
160
-
161
-
162
-
163
-
164
-
165
-
166
-
167
-
168
-
169
-
170
-
171
-
172
-
173
-
174
-
175
-
176
-
177
-
178
-
179
-
180
-
181
-
182
-
183
-
184
-
185
-
186
-
187
-
188
-
189
-
190
-
191
-
192
-
193
-
194
-
195
-
196
-
197
-
198
-
199
-
200
-
201
-
202
-
203
-
204
-
205
-
206
-
207
-
208
-
209
-
210
-
211
-
212
-
213
-
214
-
215
-
216
-
217
-
218
-
219
 |
 |

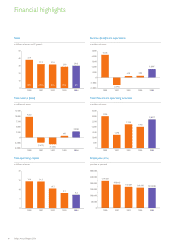
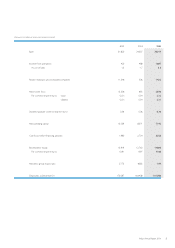
Sales
in billions of euros and % growth
37.9
20%
20042003200220012000
50
40
30
20
10
0
31.8
(2%)
29.0
(9%)
32.3
(15%)
30.3
4%
Net income (loss)
2,836
in millions of euros
695
(3,206)
(2,475)
9,662
(5,000)
(2,500)
0
2,500
5,000
7,500
10,000
12,500
20042003200220012000
Net operating capital
in billions of euros
20042003200220012000
20
15
10
5
0
7.2
14.4
10.5
8.1
14.3
Income (loss) from operations
1,607
in millions of euros
488
420
(1,395)
4,258
5,000
2,000
3,000
4,000
1,000
0
(2,000)
(1,000)
20042003200220012000
Cash flows from operating activities
in millions of euros
2,996
1,992
2,228
1,248
3,500
3,000
2,500
2,000
1,500
1,000
500
0
20042003200220012000
2,697
Employees (FTEs)
161,586
164,438
170,087
188,643
219,429
0
50,000
100,000
150,000
200,000
250,000
300,000
position at year-end
20042003200220012000
4Philips Annual Report 2004
Financial highlights