Philips 2004 Annual Report Download - page 54
Download and view the complete annual report
Please find page 54 of the 2004 Philips annual report below. You can navigate through the pages in the report by either clicking on the pages listed below, or by using the keyword search tool below to find specific information within the annual report.-
 1
1 -
2
-
3
-
4
-
5
-
6
-
7
-
8
-
9
-
10
-
11
-
12
-
13
-
14
-
15
-
16
-
17
-
18
-
19
-
20
-
21
-
22
-
23
-
24
-
25
-
26
-
27
-
28
-
29
-
30
-
31
-
32
-
33
-
34
-
35
-
36
-
37
-
38
-
39
-
40
-
41
-
42
-
43
-
 44
44 -
 45
45 -
 46
46 -
 47
47 -
 48
48 -
 49
49 -
 50
50 -
 51
51 -
 52
52 -
 53
53 -
 54
54 -
 55
55 -
 56
56 -
 57
57 -
 58
58 -
 59
59 -
 60
60 -
 61
61 -
 62
62 -
 63
63 -
 64
64 -
65
-
66
-
67
-
68
-
69
-
70
-
71
-
72
-
73
-
74
-
75
-
76
-
77
-
78
-
79
-
80
-
81
-
82
-
83
-
84
-
85
-
86
-
87
-
88
-
89
-
90
-
91
-
92
-
93
-
94
-
95
-
96
-
97
-
98
-
99
-
100
-
101
-
102
-
103
-
104
-
105
-
106
-
107
-
108
-
109
-
110
-
111
-
112
-
113
-
114
-
115
-
116
-
117
-
118
-
119
-
120
-
121
-
122
-
123
-
124
-
125
-
126
-
127
-
128
-
129
-
130
-
131
-
132
-
133
-
134
-
135
-
136
-
137
-
138
-
139
-
140
-
141
-
142
-
143
-
144
-
145
-
146
-
147
-
148
-
149
-
150
-
151
-
152
-
153
-
154
-
155
-
156
-
157
-
158
-
159
-
160
-
161
-
162
-
163
-
164
-
165
-
166
-
167
-
168
-
169
-
170
-
171
-
172
-
173
-
174
-
175
-
176
-
177
-
178
-
179
-
180
-
181
-
182
-
183
-
184
-
185
-
186
-
187
-
188
-
189
-
190
-
191
-
192
-
193
-
194
-
195
-
196
-
197
-
198
-
199
-
200
-
201
-
202
-
203
-
204
-
205
-
206
-
207
-
208
-
209
-
210
-
211
-
212
-
213
-
214
-
215
-
216
-
217
-
218
-
219
 |
 |

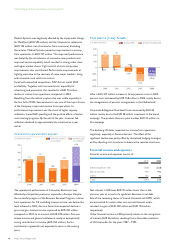
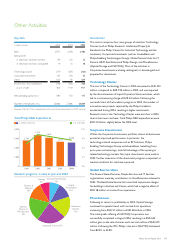
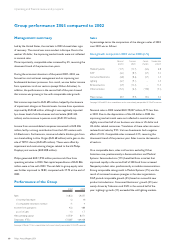
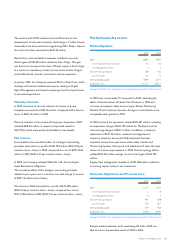
Consumer Electronics
Key data
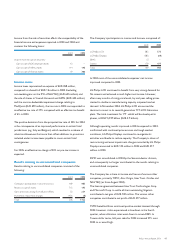
in millions of euros 2002 2003 2004
Sales 9,855 9,188 9,919
Sales growth
% (decrease) increase, nominal (7) (7) 8
% (decrease) increase, comparable (4) 2 11
Income from operations 208 248 361
asa%ofsales 2.1 2.7 3.6
Net operating capital (NOC) 46 (82) (161)
Employees (FTEs) 21,018 19,111 16,993
See pages 210 and 211 for a reconciliation to the most directly comparable US GAAP measures.
Sales and net operating capital
9.2
9.9 9.9
10.6
12.5
14
12
10
8
6
4
0
2
(2)
in billions of euros sales NOC
20042003200220012000
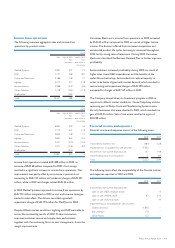
Income from operations
(585)
361
404
248
208
500
(750)
(500)
(250)
0
250
in millions of euros as a % of sales
5%
10%
0%
(5%)
(10%)
(15%)
20032002 200420012000
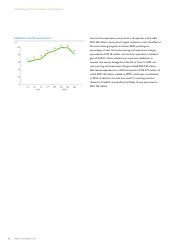
Market developments
The trend of increased competition, with PC suppliers entering CE
markets, continued in 2004, leading to further convergence. The
number of identified competitors increased from 32 in 1999 to 77
by the end of 2004. Despite the increased number of players, CE
was able to maintain its market share. After stabilizing in 2003, markets
grew an estimated 8% in 2004. Severe price reductions accelerated the
transition from traditional CRT televisions to LCD and Plasma TV.
Strategy
CE has been repositioned for future profitability, having migrated
from analog to digital, from manufacturing to marketing, and from
a broad to a more focused portfolio. CE continues to establish
partnerships with leading retailers (e.g. Dixons), to enter into
innovative alliances (e.g. Yahoo!) and to introduce new sales
channels (e.g. telecom operators). Philips and TPV Technology Limited
signed a letter of intent transferring the OEM sales, manufacturing and
development of PC monitors and entry-level Flat TVs to TPV. This
reflects our continuous effort to reduce our business risk and lower
our cost base. The Business Renewal Program is being accelerated and
is ahead of schedule to achieve EUR 400 million anticipated cost
savings by year-end 2005. By the end of 2004, savings amounted to
EUR 250 million on a run-rate basis.
Financial performance
Nominal sales growth was 8%, and was heavily impacted by the
lower US dollar. Comparable sales were up by 11%, following the
2% increase in 2003, and slightly exceeded the growth of the
market. Comparable sales growth was particularly strong in Asia
Pacific (33%) and Latin America (52%).
Comparable sales growth was driven by Connected Displays,
Licenses and, to a lesser extent, Home Entertainment Networks.
Income from operations excluding Licenses was negative and
severely impacted by net restructuring charges and a
faster-than-expected decline in gross margins, partly compensated
by savings from the Business Renewal Program. The decline in
gross margins was due to various factors, including increased price
competition, mainly in Europe, and a sharp fall in Flat TV prices in
the second half of 2004. Net restructuring charges totaled
EUR 138 million and mainly related to the closure of the front-end
projection display and Liquid Crystal on Silicon activities and the
execution of the Business Renewal Program.
Income from operations for Licenses amounted to EUR 478
million, compared to EUR 297 million in 2003. Past-use payments
and general settlements (2004: EUR 252 million; 2003: EUR 121
million) and DVD-related programs were the main drivers of the
improvement. Net operating capital at the end of 2004 amounted
to a negative of EUR 161 million, compared to a negative of
EUR 82 million in 2003.
53Philips Annual Report 2004