Philips 2004 Annual Report Download - page 176
Download and view the complete annual report
Please find page 176 of the 2004 Philips annual report below. You can navigate through the pages in the report by either clicking on the pages listed below, or by using the keyword search tool below to find specific information within the annual report.-
 1
1 -
2
-
3
-
4
-
5
-
6
-
7
-
8
-
9
-
10
-
11
-
12
-
13
-
14
-
15
-
16
-
17
-
18
-
19
-
20
-
21
-
22
-
23
-
24
-
25
-
26
-
27
-
28
-
29
-
30
-
31
-
32
-
33
-
34
-
35
-
36
-
37
-
38
-
39
-
40
-
41
-
42
-
43
-
44
-
45
-
46
-
47
-
48
-
49
-
50
-
51
-
52
-
53
-
54
-
55
-
56
-
57
-
58
-
59
-
60
-
61
-
62
-
63
-
64
-
65
-
66
-
67
-
68
-
69
-
70
-
71
-
72
-
73
-
74
-
75
-
76
-
77
-
78
-
79
-
80
-
81
-
82
-
83
-
84
-
85
-
86
-
87
-
88
-
89
-
90
-
91
-
92
-
93
-
94
-
95
-
96
-
97
-
98
-
99
-
100
-
101
-
102
-
103
-
104
-
105
-
106
-
107
-
108
-
109
-
110
-
111
-
112
-
113
-
114
-
115
-
116
-
117
-
118
-
119
-
120
-
121
-
122
-
123
-
124
-
125
-
126
-
127
-
128
-
129
-
130
-
131
-
132
-
133
-
134
-
135
-
136
-
137
-
138
-
139
-
140
-
141
-
142
-
143
-
144
-
145
-
146
-
147
-
148
-
149
-
150
-
151
-
152
-
153
-
154
-
155
-
156
-
157
-
158
-
159
-
160
-
161
-
162
-
163
-
164
-
165
-
 166
166 -
 167
167 -
 168
168 -
 169
169 -
 170
170 -
 171
171 -
 172
172 -
 173
173 -
 174
174 -
 175
175 -
 176
176 -
 177
177 -
 178
178 -
 179
179 -
 180
180 -
 181
181 -
 182
182 -
 183
183 -
 184
184 -
 185
185 -
 186
186 -
187
-
188
-
189
-
190
-
191
-
192
-
193
-
194
-
195
-
196
-
197
-
198
-
199
-
200
-
201
-
202
-
203
-
204
-
205
-
206
-
207
-
208
-
209
-
210
-
211
-
212
-
213
-
214
-
215
-
216
-
217
-
218
-
219
 |
 |

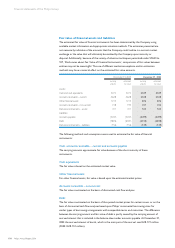
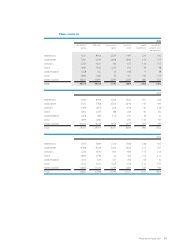
Main countries
2004
sales (to third
parties)
total assets net operating
capital
long-lived
assets
capital
expenditures
depreciation
property, plant
and equipment
Netherlands 1,201 8,456 2,559 1,497 273 342
United States 7,041 6,349 2,658 2,906 104 155
Germany 2,365 1,625 86 572 116 155
France 1,964 1,500 (207) 191 39 48
United Kingdom 1,238 522 16 186 9 38
China 2,889 1,280 33 421 165 109
Other countries 13,621 10,991 2,047 2,031 580 555
Total 30,319 30,723 7,192 7,804 1,286 1,402
2003
Netherlands 1,181 6,936 2,304 1,610 251 336
United States 7,532 7,458 3,554 3,933 140 445
Germany 2,184 1,675 259 619 90 138
France 1,952 2,267 (88) 206 40 62
United Kingdom 1,258 586 113 240 19 31
China 2,699 1,260 – 361 133 95
Other countries 12,231 9,229 1,929 1,675 307 445
Total 29,037 29,411 8,071 8,644 980 1,552
2002
Netherlands 1,507 5,694 2,724 1,596 238 350
United States 9,409 9,259 5,303 5,633 127 557
Germany 2,333 1,670 303 664 115 114
France 1,893 2,194 32 426 214 111
United Kingdom 1,503 629 251 293 18 32
China 2,510 1,311 (323) 378 112 157
Other countries 12,665 11,532 2,249 2,081 337 493
Total 31,820 32,289 10,539 11,071 1,161 1,814
175Philips Annual Report 2004