Philips 2004 Annual Report Download - page 67
Download and view the complete annual report
Please find page 67 of the 2004 Philips annual report below. You can navigate through the pages in the report by either clicking on the pages listed below, or by using the keyword search tool below to find specific information within the annual report.-
 1
1 -
2
-
3
-
4
-
5
-
6
-
7
-
8
-
9
-
10
-
11
-
12
-
13
-
14
-
15
-
16
-
17
-
18
-
19
-
20
-
21
-
22
-
23
-
24
-
25
-
26
-
27
-
28
-
29
-
30
-
31
-
32
-
33
-
34
-
35
-
36
-
37
-
38
-
39
-
40
-
41
-
42
-
43
-
44
-
45
-
46
-
47
-
48
-
49
-
50
-
51
-
52
-
53
-
54
-
55
-
56
-
 57
57 -
 58
58 -
 59
59 -
 60
60 -
 61
61 -
 62
62 -
 63
63 -
 64
64 -
 65
65 -
 66
66 -
 67
67 -
 68
68 -
 69
69 -
 70
70 -
 71
71 -
 72
72 -
 73
73 -
 74
74 -
 75
75 -
 76
76 -
 77
77 -
78
-
79
-
80
-
81
-
82
-
83
-
84
-
85
-
86
-
87
-
88
-
89
-
90
-
91
-
92
-
93
-
94
-
95
-
96
-
97
-
98
-
99
-
100
-
101
-
102
-
103
-
104
-
105
-
106
-
107
-
108
-
109
-
110
-
111
-
112
-
113
-
114
-
115
-
116
-
117
-
118
-
119
-
120
-
121
-
122
-
123
-
124
-
125
-
126
-
127
-
128
-
129
-
130
-
131
-
132
-
133
-
134
-
135
-
136
-
137
-
138
-
139
-
140
-
141
-
142
-
143
-
144
-
145
-
146
-
147
-
148
-
149
-
150
-
151
-
152
-
153
-
154
-
155
-
156
-
157
-
158
-
159
-
160
-
161
-
162
-
163
-
164
-
165
-
166
-
167
-
168
-
169
-
170
-
171
-
172
-
173
-
174
-
175
-
176
-
177
-
178
-
179
-
180
-
181
-
182
-
183
-
184
-
185
-
186
-
187
-
188
-
189
-
190
-
191
-
192
-
193
-
194
-
195
-
196
-
197
-
198
-
199
-
200
-
201
-
202
-
203
-
204
-
205
-
206
-
207
-
208
-
209
-
210
-
211
-
212
-
213
-
214
-
215
-
216
-
217
-
218
-
219
 |
 |

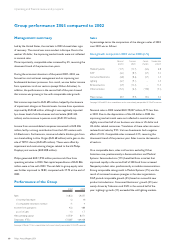
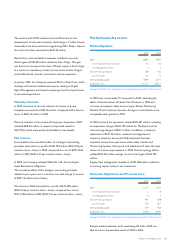
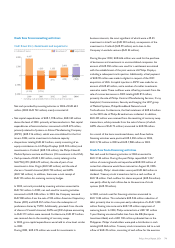
Performance by region
2002 2003
sales income (loss)
from
operations
sales income (loss)
from
operations
Europe and Africa 13,456 888 12,768 916
North America 9,804 (521) 7,911 (411)
Latin America 1,513 23 1,236 (27)
Asia Pacific 7,047 30 7,122 10
Total 31,820 420 29,037 488
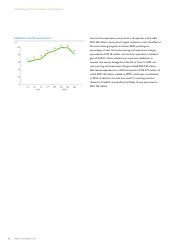
Sales
Sales in 2003 in Europe declined by 5%, partly due to the effect of
divestments and weaker currencies (e.g. the pound sterling).
Semiconductors’ sales increased again following stronger market
demand, particularly in Mobile Display Systems. Medical Systems
also recorded strong sales growth while sales were significantly
weaker in Consumer Electronics and Other Activities. The
Netherlands, Germany and the UK recorded the weakest sales
performance, partly offset by a strong rise in Eastern Europe.
Sales in North America decreased by 19% during 2003, mainly due
to the weaker US dollar. Deconsolidations had an additional
downward effect of 6%, mainly related to the divestment of HCP
in 2002. On a comparable basis, sales increased by 5%. This was
attributable to all sectors except Semiconductors, which
continued to suffer from weak market demand, especially in the
first half of the year. Sales in Latin America declined by 18%, mainly
as a result of significantly weaker currencies following the collapse
of the Argentinian and Venezuelan economies. All sectors were
affected.
Sales in Asia Pacific increased by 1% in 2003 compared to 2002,
hampered by the negative effect of weaker currencies following
the decline of the US dollar. On a comparable basis, sales grew by
16% in 2003, headed by soaring sales in China (34% higher).
Excluding the effects of changes in consolidations and currencies,
sales in all sectors except DAP increased strongly, in particular at
Semiconductors, in the second half of 2003.
Income from operations
The improvement in income from operations in 2003 on a global
level was mainly attributable to Europe and North America.
Despite the considerable improvement in North America, this
region was still loss-making, due to restructuring charges at
Semiconductors and an impairment charge for MedQuist.
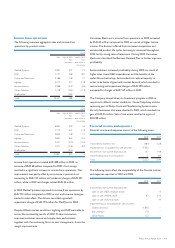
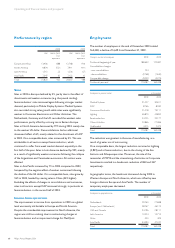
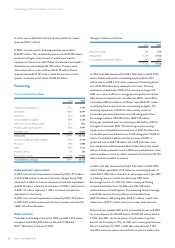
Employment
The number of employees at the end of December 2003 totaled
164,438, a decline of 5,649 from December 31, 2002.
Change in number of employees 2002 2003
Position at beginning of year 188,643 170,087
Consolidation changes:
- new consolidations 254 –
- deconsolidations (9,768) (1,630)
Comparable change (9,042) (4,019)
Position at year-end 170,087 164,438
Employees by product sector at the end of
2002 2003
Medical Systems 31,027 30,611
DAP 8,766 8,180
Consumer Electronics 21,018 19,111
Lighting 46,870 43,800
Semiconductors 34,225 33,177
Other Activities 23,866 27,086
Unallocated 4,315 2,473
Total 170,087 164,438
The reduction was greatest in the area of manufacturing, as a
result of greater use of outsourcing.
On a comparable basis, the largest reduction occurred at Lighting
(2,859) and at Semiconductors, due to the closing of the San
Antonio and Albuquerque sites. Moreover, the sale of the
remainder of PCMS and the streamlining of activities in Corporate
Investments resulted in a headcount reduction of 843 and 347
respectively.
In geographic terms, the headcount decreased during 2003 in
Western Europe and North America, which was offset by new
hirings in Eastern Europe and Asia Pacific. The number of
temporary employees decreased.
Employees by geographic area at the end of
2002 2003
Netherlands 29,260 27,688
Europe (excl. Netherlands) 48,267 46,174
USA and Canada 34,196 28,111
Latin America 13,424 14,714
Africa 450 409
Asia Pacific 44,490 47,342
Total 170,087 164,438
66 Philips Annual Report 2004
Operating and financial review and prospects