Philips 2004 Annual Report Download - page 211
Download and view the complete annual report
Please find page 211 of the 2004 Philips annual report below. You can navigate through the pages in the report by either clicking on the pages listed below, or by using the keyword search tool below to find specific information within the annual report.-
 1
1 -
2
-
3
-
4
-
5
-
6
-
7
-
8
-
9
-
10
-
11
-
12
-
13
-
14
-
15
-
16
-
17
-
18
-
19
-
20
-
21
-
22
-
23
-
24
-
25
-
26
-
27
-
28
-
29
-
30
-
31
-
32
-
33
-
34
-
35
-
36
-
37
-
38
-
39
-
40
-
41
-
42
-
43
-
44
-
45
-
46
-
47
-
48
-
49
-
50
-
51
-
52
-
53
-
54
-
55
-
56
-
57
-
58
-
59
-
60
-
61
-
62
-
63
-
64
-
65
-
66
-
67
-
68
-
69
-
70
-
71
-
72
-
73
-
74
-
75
-
76
-
77
-
78
-
79
-
80
-
81
-
82
-
83
-
84
-
85
-
86
-
87
-
88
-
89
-
90
-
91
-
92
-
93
-
94
-
95
-
96
-
97
-
98
-
99
-
100
-
101
-
102
-
103
-
104
-
105
-
106
-
107
-
108
-
109
-
110
-
111
-
112
-
113
-
114
-
115
-
116
-
117
-
118
-
119
-
120
-
121
-
122
-
123
-
124
-
125
-
126
-
127
-
128
-
129
-
130
-
131
-
132
-
133
-
134
-
135
-
136
-
137
-
138
-
139
-
140
-
141
-
142
-
143
-
144
-
145
-
146
-
147
-
148
-
149
-
150
-
151
-
152
-
153
-
154
-
155
-
156
-
157
-
158
-
159
-
160
-
161
-
162
-
163
-
164
-
165
-
166
-
167
-
168
-
169
-
170
-
171
-
172
-
173
-
174
-
175
-
176
-
177
-
178
-
179
-
180
-
181
-
182
-
183
-
184
-
185
-
186
-
187
-
188
-
189
-
190
-
191
-
192
-
193
-
194
-
195
-
196
-
197
-
198
-
199
-
200
-
 201
201 -
 202
202 -
 203
203 -
 204
204 -
 205
205 -
 206
206 -
 207
207 -
 208
208 -
 209
209 -
 210
210 -
 211
211 -
 212
212 -
 213
213 -
 214
214 -
 215
215 -
 216
216 -
 217
217 -
 218
218 -
 219
219
 |
 |

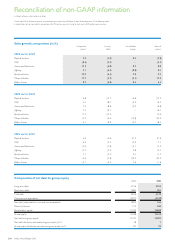
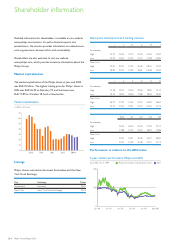
Sales growth composition (in %)
Comparable
growth
Currency
effects
Consolidation
changes
Nominal
growth
2004 versus 2003
Medical Systems 3.9 (5.9) 0.2 (1.8)
DAP (0.6) (3.5) – (4.1)
Consumer Electronics 11.3 (4.0) 0.7 8.0
Lighting 5.1 (4.2) (0.8) 0.1
Semiconductors 12.9 (6.4) 3.0 9.5
Other Activities 17.7 (3.7) (2.1) 11.9
Philips Group 8.7 (4.8) 0.5 4.4
2003 versus 2002
Medical Systems 6.8 (12.7) (6.6) (12.5)
DAP 3.0 (8.7) (0.5) (6.2)
Consumer Electronics 2.3 (8.6) (0.5) (6.8)
Lighting 2.4 (9.1) – (6.7)
Semiconductors 11.4 (12.3) – (0.9)
Other Activities (5.2) (6.3) (13.8) (25.3)
Philips Group 4.2 (9.9) (3.0) (8.7)
2002 versus 2001
Medical Systems 4.9 (4.6) 41.3 41.6
DAP 6.3 (3.2) (0.9) 2.2
Consumer Electronics (4.4) (2.8) (0.1) (7.3)
Lighting (2.2) (3.3) 0.8 (4.7)
Semiconductors 2.1 (3.3) 0.0 (1.2)
Other Activities (4.4) (3.8) (25.3) (33.5)
Philips Group (0.7) (3.5) 2.6 (1.6)
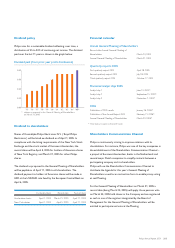
Composition of net debt to group equity
2003 2004
Long-term debt 4,016 3,552
Short-term debt 1,860 961
Total debt 5,876 4,513
Cash and cash equivalents (3,072) (4,349)
Net debt (total debt less cash and cash equivalents) 2,804 164
Minority interests 175 283
Stockholders’ equity 12,763 14,860
Group equity 12,938 15,143
Net debt and group equity 15,742 15,307
Net debt divided by net debt and group equity (in %) 18 1
Group equity divided by net debt and group equity (in %) 82 99
210 Philips Annual Report 2004
Reconciliation of non-GAAP information
in millions of euros unless otherwise stated
Certain non-GAAP financial measures are presented when discussing the Philips Group’s financial position. In the following tables,
a reconciliation to the most directly comparable GAAP financial measure is made for each non-GAAP performance measure.