Philips 2004 Annual Report Download - page 46
Download and view the complete annual report
Please find page 46 of the 2004 Philips annual report below. You can navigate through the pages in the report by either clicking on the pages listed below, or by using the keyword search tool below to find specific information within the annual report.-
 1
1 -
2
-
3
-
4
-
5
-
6
-
7
-
8
-
9
-
10
-
11
-
12
-
13
-
14
-
15
-
16
-
17
-
18
-
19
-
20
-
21
-
22
-
23
-
24
-
25
-
26
-
27
-
28
-
29
-
30
-
31
-
32
-
33
-
34
-
35
-
 36
36 -
 37
37 -
 38
38 -
 39
39 -
 40
40 -
 41
41 -
 42
42 -
 43
43 -
 44
44 -
 45
45 -
 46
46 -
 47
47 -
 48
48 -
 49
49 -
 50
50 -
 51
51 -
 52
52 -
 53
53 -
 54
54 -
 55
55 -
 56
56 -
57
-
58
-
59
-
60
-
61
-
62
-
63
-
64
-
65
-
66
-
67
-
68
-
69
-
70
-
71
-
72
-
73
-
74
-
75
-
76
-
77
-
78
-
79
-
80
-
81
-
82
-
83
-
84
-
85
-
86
-
87
-
88
-
89
-
90
-
91
-
92
-
93
-
94
-
95
-
96
-
97
-
98
-
99
-
100
-
101
-
102
-
103
-
104
-
105
-
106
-
107
-
108
-
109
-
110
-
111
-
112
-
113
-
114
-
115
-
116
-
117
-
118
-
119
-
120
-
121
-
122
-
123
-
124
-
125
-
126
-
127
-
128
-
129
-
130
-
131
-
132
-
133
-
134
-
135
-
136
-
137
-
138
-
139
-
140
-
141
-
142
-
143
-
144
-
145
-
146
-
147
-
148
-
149
-
150
-
151
-
152
-
153
-
154
-
155
-
156
-
157
-
158
-
159
-
160
-
161
-
162
-
163
-
164
-
165
-
166
-
167
-
168
-
169
-
170
-
171
-
172
-
173
-
174
-
175
-
176
-
177
-
178
-
179
-
180
-
181
-
182
-
183
-
184
-
185
-
186
-
187
-
188
-
189
-
190
-
191
-
192
-
193
-
194
-
195
-
196
-
197
-
198
-
199
-
200
-
201
-
202
-
203
-
204
-
205
-
206
-
207
-
208
-
209
-
210
-
211
-
212
-
213
-
214
-
215
-
216
-
217
-
218
-
219
 |
 |

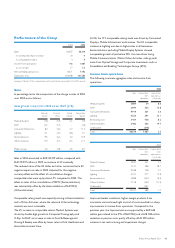
Performance of the Group
2003 2004
Sales 29,037 30,319
% nominal (decrease) increase (9) 4
% comparable increase 4 9
Income from operations 488 1,607
asa%ofsales 1.7 5.3
Net operating capital (NOC) 8,071 7,192
Employees (FTEs) 164,438 161,586
See pages 210 and 211 for a reconciliation to the most directly comparable US GAAP measures.
Sales
In percentage terms the composition of the change in sales of 2004
over 2003 was as follows:
Sales growth composition 2004 versus 2003 (in %)
Nominal
growth
Currency
effects
Consol.
changes
Comparable
growth
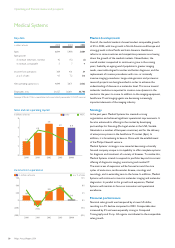
Medical Systems (1.8) (5.9) 0.2 3.9
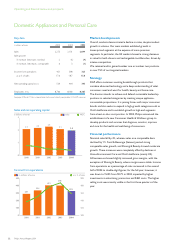
DAP (4.1) (3.5) – (0.6)
Consumer Electronics 8.0 (4.0) 0.7 11.3
Lighting 0.1 (4.2) (0.8) 5.1
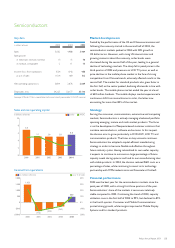
Semiconductors 9.5 (6.4) 3.0 12.9
Other Activities 11.9 (3.7) (2.1) 17.7
Philips Group 4.4 (4.8) 0.5 8.7
Sales in 2004 amounted to EUR 30,319 million, compared with
EUR 29,037 million in 2003, an increase of 4% nominally.
The reduced value of the US dollar and other currencies had a 5%
negative impact on sales in 2004. Adjusted for this negative
currency effect and the effect of consolidation changes,
comparable sales were up by almost 9% compared to 2003. The
effect on sales of the consolidation of SSMC (Semiconductors)
was substantially offset by the deconsolidation of NAVTEQ
(Other Activities).
Comparable sales growth was especially strong at Semiconductors
and in Other Activities, where the rebound of the technology
markets was most noticeable.
The 4% increase in comparable sales at Medical Systems was
driven by double-digit growth at Computed Tomography and
X-Ray. At DAP, an increase in sales at Food & Beverage and
Shaving & Beauty was offset by lower sales at Oral Healthcare and
Home Environment Care.
At CE, the 11% comparable sales growth was driven by Connected
Displays, Mobile Infotainment and Licenses. The 5% comparable
increase at Lighting was due to higher sales in all businesses.
Semiconductors excluding Mobile Display Systems showed
comparable growth of just below 20%, the main driver being
Mobile Communications. Within Other Activities, sales growth
came from Optical Storage and Corporate Investments such as
Assembléon and Enabling Technologies Group (ETG).
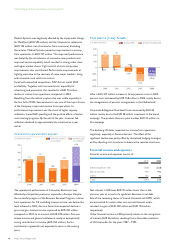
Income from operations
The following overview aggregates sales and income from
operations.
2004
sales income (loss)
from
operations
income from
operations as
a % of sales
Medical Systems 5,884 34 0.6
DAP 2,044 323 15.8
Consumer Electronics 9,919 361 3.6
Lighting 4,526 591 13.1
Semiconductors 5,464 450 8.2
Other Activities 2,482 366 14.7
Unallocated – (518)–
Total 30,319 1,607 5.3
2003
sales income (loss)
from
operations
income (loss)
from
operations as
a % of sales
Medical Systems 5,990 431 7.2
DAP 2,131 398 18.7
Consumer Electronics 9,188 248 2.7
Lighting 4,522 577 12.8
Semiconductors 4,988 (342) (6.9)
Other Activities 2,218 (263) (11.9)
Unallocated – (561)–
Total 29,037 488 1.7
Improved market conditions, higher-margin products from
innovation and continued tight control of costs resulted in a sharp
improvement in income from operations. Compared to the
previous year, the improvement was supported by a EUR 635
million gain related to the IPO of NAVTEQ and a EUR 158 million
reduction in pension costs, partly offset by a EUR 329 million
increase in net restructuring and impairment charges.
45Philips Annual Report 2004