Philips 2004 Annual Report Download - page 62
Download and view the complete annual report
Please find page 62 of the 2004 Philips annual report below. You can navigate through the pages in the report by either clicking on the pages listed below, or by using the keyword search tool below to find specific information within the annual report.-
 1
1 -
2
-
3
-
4
-
5
-
6
-
7
-
8
-
9
-
10
-
11
-
12
-
13
-
14
-
15
-
16
-
17
-
18
-
19
-
20
-
21
-
22
-
23
-
24
-
25
-
26
-
27
-
28
-
29
-
30
-
31
-
32
-
33
-
34
-
35
-
36
-
37
-
38
-
39
-
40
-
41
-
42
-
43
-
44
-
45
-
46
-
47
-
48
-
49
-
50
-
51
-
 52
52 -
 53
53 -
 54
54 -
 55
55 -
 56
56 -
 57
57 -
 58
58 -
 59
59 -
 60
60 -
 61
61 -
 62
62 -
 63
63 -
 64
64 -
 65
65 -
 66
66 -
 67
67 -
 68
68 -
 69
69 -
 70
70 -
 71
71 -
 72
72 -
73
-
74
-
75
-
76
-
77
-
78
-
79
-
80
-
81
-
82
-
83
-
84
-
85
-
86
-
87
-
88
-
89
-
90
-
91
-
92
-
93
-
94
-
95
-
96
-
97
-
98
-
99
-
100
-
101
-
102
-
103
-
104
-
105
-
106
-
107
-
108
-
109
-
110
-
111
-
112
-
113
-
114
-
115
-
116
-
117
-
118
-
119
-
120
-
121
-
122
-
123
-
124
-
125
-
126
-
127
-
128
-
129
-
130
-
131
-
132
-
133
-
134
-
135
-
136
-
137
-
138
-
139
-
140
-
141
-
142
-
143
-
144
-
145
-
146
-
147
-
148
-
149
-
150
-
151
-
152
-
153
-
154
-
155
-
156
-
157
-
158
-
159
-
160
-
161
-
162
-
163
-
164
-
165
-
166
-
167
-
168
-
169
-
170
-
171
-
172
-
173
-
174
-
175
-
176
-
177
-
178
-
179
-
180
-
181
-
182
-
183
-
184
-
185
-
186
-
187
-
188
-
189
-
190
-
191
-
192
-
193
-
194
-
195
-
196
-
197
-
198
-
199
-
200
-
201
-
202
-
203
-
204
-
205
-
206
-
207
-
208
-
209
-
210
-
211
-
212
-
213
-
214
-
215
-
216
-
217
-
218
-
219
 |
 |

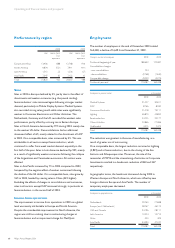
Income from operations
The following overview aggregates sales and income from
operations by product sector.
2003
sales income (loss)
from
operations
income (loss)
from
operations as
a % of sales
Medical Systems 5,990 431 7.2
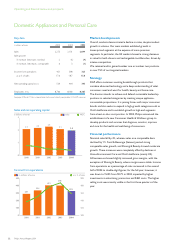
DAP 2,131 398 18.7
Consumer Electronics 9,188 248 2.7
Lighting 4,522 577 12.8
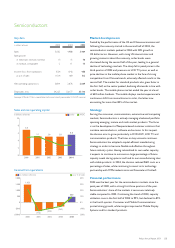
Semiconductors 4,988 (342) (6.9)
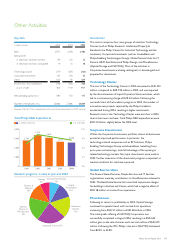
Other Activities 2,218 (263) (11.9)
Unallocated – (561)–
Total 29,037 488 1.7
2002
sales income (loss)
from
operations
income (loss)
from
operations as
a % of sales
Medical Systems 6,844 309 4.5
DAP 2,273 401 17.6
Consumer Electronics 9,855 208 2.1
Lighting 4,845 602 12.4
Semiconductors 5,032 (524) (10.4)
Other Activities 2,971 (246) (8.3)
Unallocated – (330)–
Total 31,820 420 1.3
Income from operations totaled EUR 488 million in 2003, an
increase of EUR 68 million compared to 2002. Cost savings
resulted in a significant increase in income from operations. The
improvement was partly offset by an increase in pension cost
amounting to EUR 312 million and incidental charges of EUR 431
million, while in 2002 net charges totaled EUR 40 million.
In 2003 Medical Systems improved its income from operations by
EUR 122 million compared to 2002 as cost and revenue synergies
started to take effect. The division recorded a goodwill
impairment charge of EUR 139 million for MedQuist in 2003.
Despite difficult market conditions, Lighting and DAP were able to
mirror the outstanding results of 2002. Product innovation,
improved customer service and supply chain performance
together with the continuing focus on cost management, drove the
margin improvements.
Consumer Electronics’ income from operations in 2003 increased
by EUR 40 million compared to 2002 as a result of higher license
income. The division suffered from increased competition and
accelerated product life cycles, but margins increased throughout
2003, led by strong sales of televisions. During 2003, Consumer
Electronics launched the Business Renewal Plan to further improve
profitability.
Semiconductors increased profitability during 2003 as a result of
higher sales, lower R&D expenditures and the benefits of the
wafer-fab restructurings. Semiconductors reduced capacity in
order to be better aligned with market demand, which resulted in
restructuring and impairment charges of EUR 290 million
compared to charges of EUR 167 million in 2002.
The Company slowed down its divestment program in 2003 in
response to difficult market conditions. Vocon/Telephony and the
remaining part of Philips Contract Manufacturing Systems were
the only businesses that were divested in 2003, which resulted in a
gain of EUR 35 million. Sale of real estate resulted in a gain of
EUR 88 million.
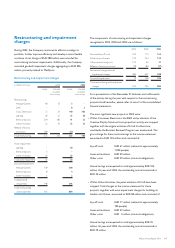
Financial income and expenses
Financial income and expenses consist of the following items:
2002 2003
Total interest expense, net (384) (328)
Impairment loss on available-for-sale securities (1,955) –
Income from non-current financial assets 107 148
Other financial income and expenses 5 (64)
Total (2,227) (244)
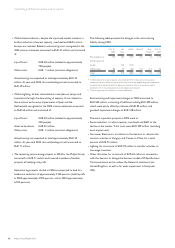
The following items affect the comparability of the financial income
and expenses reported in 2002 and 2003:
2002 2003
Income from non-current financial assets:
Gain on sale of JDS Uniphase shares – 13
Gain on sale of ASML shares 67 114
Gain on sale of Vivendi shares – 19
Impairment losses on available-for-sale securities:
Vivendi Universal (1,855) –
JDS Uniphase (73) –
Great Nordic (27) –
61Philips Annual Report 2004