Philips 2004 Annual Report Download - page 121
Download and view the complete annual report
Please find page 121 of the 2004 Philips annual report below. You can navigate through the pages in the report by either clicking on the pages listed below, or by using the keyword search tool below to find specific information within the annual report.-
 1
1 -
2
-
3
-
4
-
5
-
6
-
7
-
8
-
9
-
10
-
11
-
12
-
13
-
14
-
15
-
16
-
17
-
18
-
19
-
20
-
21
-
22
-
23
-
24
-
25
-
26
-
27
-
28
-
29
-
30
-
31
-
32
-
33
-
34
-
35
-
36
-
37
-
38
-
39
-
40
-
41
-
42
-
43
-
44
-
45
-
46
-
47
-
48
-
49
-
50
-
51
-
52
-
53
-
54
-
55
-
56
-
57
-
58
-
59
-
60
-
61
-
62
-
63
-
64
-
65
-
66
-
67
-
68
-
69
-
70
-
71
-
72
-
73
-
74
-
75
-
76
-
77
-
78
-
79
-
80
-
81
-
82
-
83
-
84
-
85
-
86
-
87
-
88
-
89
-
90
-
91
-
92
-
93
-
94
-
95
-
96
-
97
-
98
-
99
-
100
-
101
-
102
-
103
-
104
-
105
-
106
-
107
-
108
-
109
-
110
-
 111
111 -
 112
112 -
 113
113 -
 114
114 -
 115
115 -
 116
116 -
 117
117 -
 118
118 -
 119
119 -
 120
120 -
 121
121 -
 122
122 -
 123
123 -
 124
124 -
 125
125 -
 126
126 -
 127
127 -
 128
128 -
 129
129 -
 130
130 -
 131
131 -
132
-
133
-
134
-
135
-
136
-
137
-
138
-
139
-
140
-
141
-
142
-
143
-
144
-
145
-
146
-
147
-
148
-
149
-
150
-
151
-
152
-
153
-
154
-
155
-
156
-
157
-
158
-
159
-
160
-
161
-
162
-
163
-
164
-
165
-
166
-
167
-
168
-
169
-
170
-
171
-
172
-
173
-
174
-
175
-
176
-
177
-
178
-
179
-
180
-
181
-
182
-
183
-
184
-
185
-
186
-
187
-
188
-
189
-
190
-
191
-
192
-
193
-
194
-
195
-
196
-
197
-
198
-
199
-
200
-
201
-
202
-
203
-
204
-
205
-
206
-
207
-
208
-
209
-
210
-
211
-
212
-
213
-
214
-
215
-
216
-
217
-
218
-
219
 |
 |

O
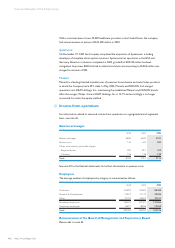
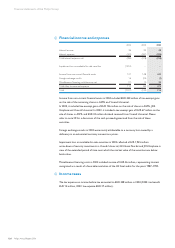
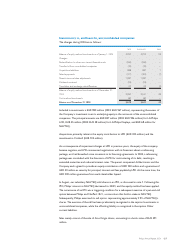
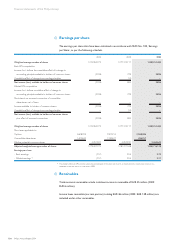
3Financial income and expenses
2002 2003 2004
Interest income 36 33 48
Interest expense (420) (361) (306)
Total interest expense, net (384) (328) (258)
Impairment loss on available-for-sale securities (1,955) – –
Income from non-current financial assets 107 148 442
Foreign exchange results 16 (59) (1)
Miscellaneous financing costs/income, net (11)(5)33
Total other income and expense 112 84 474
Total (2,227) (244) 216
Income from non-current financial assets in 2004 included EUR 440 million of tax-exempt gains
on the sale of the remaining shares in ASML and Vivendi Universal.
In 2003, it included tax-exempt gains of EUR 146 million on the sale of shares in ASML, JDS
Uniphase and Vivendi Universal. In 2002, it included a tax-exempt gain of EUR 67 million on the
sale of shares in ASML and EUR 33 million dividend received from Vivendi Universal. Please
refer to note 29 for a discussion of the cash proceeds generated from the sale of these
securities.
Foreign exchange results in 2003 were mainly attributable to a currency loss caused by a
deficiency in an automated currency conversion system.
Impairment loss on available-for-sale securities in 2002 reflected a EUR 1,955 million
write-down of security investments in Vivendi Universal, GN Great Nordic and JDS Uniphase in
view of the extended period of time over which the market value of the securities was below
book value.
Miscellaneous financing costs in 2004 included income of EUR 46 million, representing interest
recognized as a result of a favorable resolution of the US fiscal audits for the years 1987–1992.
O
4Income taxes
The tax expense on income before tax amounted to EUR 358 million in 2004 (2003: tax benefit
EUR 15 million, 2002: tax expense EUR 27 million).
120 Philips Annual Report 2004
Financial statements of the Philips Group