Philips 2004 Annual Report Download - page 131
Download and view the complete annual report
Please find page 131 of the 2004 Philips annual report below. You can navigate through the pages in the report by either clicking on the pages listed below, or by using the keyword search tool below to find specific information within the annual report.-
 1
1 -
2
-
3
-
4
-
5
-
6
-
7
-
8
-
9
-
10
-
11
-
12
-
13
-
14
-
15
-
16
-
17
-
18
-
19
-
20
-
21
-
22
-
23
-
24
-
25
-
26
-
27
-
28
-
29
-
30
-
31
-
32
-
33
-
34
-
35
-
36
-
37
-
38
-
39
-
40
-
41
-
42
-
43
-
44
-
45
-
46
-
47
-
48
-
49
-
50
-
51
-
52
-
53
-
54
-
55
-
56
-
57
-
58
-
59
-
60
-
61
-
62
-
63
-
64
-
65
-
66
-
67
-
68
-
69
-
70
-
71
-
72
-
73
-
74
-
75
-
76
-
77
-
78
-
79
-
80
-
81
-
82
-
83
-
84
-
85
-
86
-
87
-
88
-
89
-
90
-
91
-
92
-
93
-
94
-
95
-
96
-
97
-
98
-
99
-
100
-
101
-
102
-
103
-
104
-
105
-
106
-
107
-
108
-
109
-
110
-
111
-
112
-
113
-
114
-
115
-
116
-
117
-
118
-
119
-
120
-
 121
121 -
 122
122 -
 123
123 -
 124
124 -
 125
125 -
 126
126 -
 127
127 -
 128
128 -
 129
129 -
 130
130 -
 131
131 -
 132
132 -
 133
133 -
 134
134 -
 135
135 -
 136
136 -
 137
137 -
 138
138 -
 139
139 -
 140
140 -
 141
141 -
142
-
143
-
144
-
145
-
146
-
147
-
148
-
149
-
150
-
151
-
152
-
153
-
154
-
155
-
156
-
157
-
158
-
159
-
160
-
161
-
162
-
163
-
164
-
165
-
166
-
167
-
168
-
169
-
170
-
171
-
172
-
173
-
174
-
175
-
176
-
177
-
178
-
179
-
180
-
181
-
182
-
183
-
184
-
185
-
186
-
187
-
188
-
189
-
190
-
191
-
192
-
193
-
194
-
195
-
196
-
197
-
198
-
199
-
200
-
201
-
202
-
203
-
204
-
205
-
206
-
207
-
208
-
209
-
210
-
211
-
212
-
213
-
214
-
215
-
216
-
217
-
218
-
219
 |
 |

O
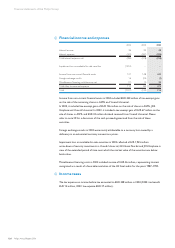
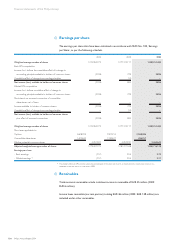
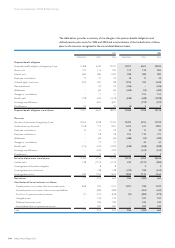
8Earnings per share
The earnings per share data have been calculated in accordance with SFAS No. 128, ‘Earnings
per Share’, as per the following schedule:
2002 2003 2004
Weighted average number of shares 1,274,950,373 1,277,174,117 1,280,251,485
Basic EPS computation
Income (loss) before the cumulative effect of a change in
accounting principle available to holders of common shares (3,206) 709 2,836
Cumulative effect of change in accounting principles – (14) –
Net income (loss) available to holders of common shares (3,206) 695 2,836
Diluted EPS computation
Income (loss) before cumulative effect of change in
accounting principle available to holders of common shares (3,206) 709 2,836
Plus interest on assumed conversion of convertible
debentures, net of taxes – ––
Income available to holders of common shares (3,206) 709 2,836
Cumulative effect of change in accounting principle – (14) –
Net income (loss) available to holders of common shares
plus effect of assumed conversions (3,206) 695 2,836
Weighted average number of shares 1,274,950,373 1,277,174,117 1,280,251,485
Plus shares applicable to:
Options 2,628,259 2,922,314 2,968,386
Convertible debentures 1,423,643 1,130,617 496,257
Dilutive potential common shares 4,051,902 4,052,931 3,464,643
Adjusted weighted average number of shares 1,279,002,275 1,281,227,048 1,283,716,128
Earnings per share:
- Basic earnings (2.51) 0.54 2.22
- Diluted earnings * (2.51) 0.54 2.21
*The dilution effects on EPS are only taken into consideration if this does not result in an improvement in income per share or in a
reduction in loss per share, as is the case in 2002.
O
9Receivables
Trade accounts receivable include instalment accounts receivable of EUR 45 million (2003:
EUR 6 million).
Income taxes receivable (current portion) totaling EUR 46 million (2003: EUR 138 million) are
included under other receivables.
130 Philips Annual Report 2004
Financial statements of the Philips Group