Philips 2004 Annual Report Download - page 188
Download and view the complete annual report
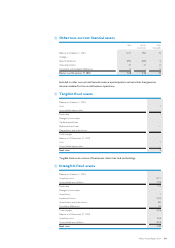
Please find page 188 of the 2004 Philips annual report below. You can navigate through the pages in the report by either clicking on the pages listed below, or by using the keyword search tool below to find specific information within the annual report.-
 1
1 -
2
-
3
-
4
-
5
-
6
-
7
-
8
-
9
-
10
-
11
-
12
-
13
-
14
-
15
-
16
-
17
-
18
-
19
-
20
-
21
-
22
-
23
-
24
-
25
-
26
-
27
-
28
-
29
-
30
-
31
-
32
-
33
-
34
-
35
-
36
-
37
-
38
-
39
-
40
-
41
-
42
-
43
-
44
-
45
-
46
-
47
-
48
-
49
-
50
-
51
-
52
-
53
-
54
-
55
-
56
-
57
-
58
-
59
-
60
-
61
-
62
-
63
-
64
-
65
-
66
-
67
-
68
-
69
-
70
-
71
-
72
-
73
-
74
-
75
-
76
-
77
-
78
-
79
-
80
-
81
-
82
-
83
-
84
-
85
-
86
-
87
-
88
-
89
-
90
-
91
-
92
-
93
-
94
-
95
-
96
-
97
-
98
-
99
-
100
-
101
-
102
-
103
-
104
-
105
-
106
-
107
-
108
-
109
-
110
-
111
-
112
-
113
-
114
-
115
-
116
-
117
-
118
-
119
-
120
-
121
-
122
-
123
-
124
-
125
-
126
-
127
-
128
-
129
-
130
-
131
-
132
-
133
-
134
-
135
-
136
-
137
-
138
-
139
-
140
-
141
-
142
-
143
-
144
-
145
-
146
-
147
-
148
-
149
-
150
-
151
-
152
-
153
-
154
-
155
-
156
-
157
-
158
-
159
-
160
-
161
-
162
-
163
-
164
-
165
-
166
-
167
-
168
-
169
-
170
-
171
-
172
-
173
-
174
-
175
-
176
-
177
-
 178
178 -
 179
179 -
 180
180 -
 181
181 -
 182
182 -
 183
183 -
 184
184 -
 185
185 -
 186
186 -
 187
187 -
 188
188 -
 189
189 -
 190
190 -
 191
191 -
 192
192 -
 193
193 -
 194
194 -
 195
195 -
 196
196 -
 197
197 -
 198
198 -
199
-
200
-
201
-
202
-
203
-
204
-
205
-
206
-
207
-
208
-
209
-
210
-
211
-
212
-
213
-
214
-
215
-
216
-
217
-
218
-
219
 |
 |

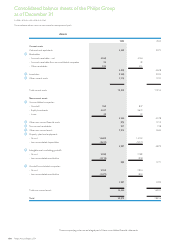
Balance sheets as of December 31
2004 2003
Assets
Current assets:
Cash and cash equivalents 3,597 2,368
O
AReceivables 8,503 5,592
12,100 7,960
Non-current assets:
O
BInvestments in affiliated companies 15,713 14,754
O
COther non-current financial assets 168 1,015
O
DTangible fixed assets – net 11
O
EIntangible assets – net 137 773
16,019 16,543
Total 28,119 24,503
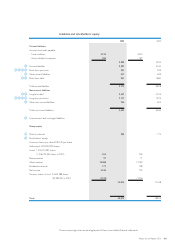
Liabilities and stockholders’ equity
Current liabilities:
O
FOther liabilities 626 535
O
GShort-term debt 10,147 7,867
O
HShort-term provisions 39 89
10,812 8,491
Non-current liabilities:
O
ILong-term debt 3,161 3,809
O
HLong-term provisions 130 35
3,291 3,844
O
JStockholders’ equity:
Priority shares, par value EUR 500 per share:
Authorized and issued: 10 shares
Preference shares, par value EUR 0.20 per share:
Authorized: 3,249,975,000 shares
Issued: none
Common shares, par value EUR 0.20 per share:
Authorized: 3,250,000,000 shares
Issued: 1,316,070,392 shares (2004 and 2003) 263 263
Share premium 97 71
Other reserves 12,388 12,187
Revaluation reserves 171 198
Undistributed profit 2,336* 705
Treasury shares, at cost: 34,543,388 shares
(35,384,362 shares in 2003) (1,239)(1,256)
14,016 12,168
Total 28,119 24,503
Statements of income
Income after taxes from affiliated companies 2,431 48
Other income (loss) after taxes (95) 657
O
KNet income 2,336 705
*of the undistributed profit of 2004, EUR 513 million is to be paid as dividend and EUR 1,823 million is to be reserved.
187Philips Annual Report 2004
Balance sheets and statements of income of Royal Philips Electronics
in millions of euros
The balance sheets are presented before appropriation of profit