Philips 2004 Annual Report Download - page 212
Download and view the complete annual report
Please find page 212 of the 2004 Philips annual report below. You can navigate through the pages in the report by either clicking on the pages listed below, or by using the keyword search tool below to find specific information within the annual report.-
 1
1 -
2
-
3
-
4
-
5
-
6
-
7
-
8
-
9
-
10
-
11
-
12
-
13
-
14
-
15
-
16
-
17
-
18
-
19
-
20
-
21
-
22
-
23
-
24
-
25
-
26
-
27
-
28
-
29
-
30
-
31
-
32
-
33
-
34
-
35
-
36
-
37
-
38
-
39
-
40
-
41
-
42
-
43
-
44
-
45
-
46
-
47
-
48
-
49
-
50
-
51
-
52
-
53
-
54
-
55
-
56
-
57
-
58
-
59
-
60
-
61
-
62
-
63
-
64
-
65
-
66
-
67
-
68
-
69
-
70
-
71
-
72
-
73
-
74
-
75
-
76
-
77
-
78
-
79
-
80
-
81
-
82
-
83
-
84
-
85
-
86
-
87
-
88
-
89
-
90
-
91
-
92
-
93
-
94
-
95
-
96
-
97
-
98
-
99
-
100
-
101
-
102
-
103
-
104
-
105
-
106
-
107
-
108
-
109
-
110
-
111
-
112
-
113
-
114
-
115
-
116
-
117
-
118
-
119
-
120
-
121
-
122
-
123
-
124
-
125
-
126
-
127
-
128
-
129
-
130
-
131
-
132
-
133
-
134
-
135
-
136
-
137
-
138
-
139
-
140
-
141
-
142
-
143
-
144
-
145
-
146
-
147
-
148
-
149
-
150
-
151
-
152
-
153
-
154
-
155
-
156
-
157
-
158
-
159
-
160
-
161
-
162
-
163
-
164
-
165
-
166
-
167
-
168
-
169
-
170
-
171
-
172
-
173
-
174
-
175
-
176
-
177
-
178
-
179
-
180
-
181
-
182
-
183
-
184
-
185
-
186
-
187
-
188
-
189
-
190
-
191
-
192
-
193
-
194
-
195
-
196
-
197
-
198
-
199
-
200
-
201
-
 202
202 -
 203
203 -
 204
204 -
 205
205 -
 206
206 -
 207
207 -
 208
208 -
 209
209 -
 210
210 -
 211
211 -
 212
212 -
 213
213 -
 214
214 -
 215
215 -
 216
216 -
 217
217 -
 218
218 -
 219
219
 |
 |

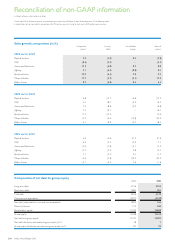
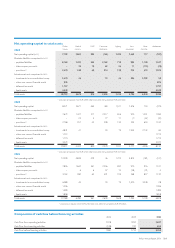
Net operating capital to total assets
Philips
Group
Medical
Systems
DAP Consumer
Electronics
Lighting Semi-
conductors
Other
Activities
Unallocated
2004
Net operating capital (NOC) 7,192 2,862 393 (161) 1,493 2,669 117 (181)
Eliminate liabilities comprised in NOC:
- payables/liabilities 8,169 1,492 353 2,162 710 985 1,120 1,347
- intercompany accounts – 35 10 62 26 11 (115) (29)
- provisions1) 2,670 240 60 314 138 225 619 1,074
Include assets not comprised in NOC:
- investments in unconsolidated comp. 5,670 46 19 46 306 5,203 50
- other non-current financial assets 876 876
- deferred tax assets 1,797 1,797
- liquid assets 4,349 4,349
Total assets 30,723 4,675 816 2,396 2,413 4,196 6,944 9,283
1) provisions on balance sheet EUR 2,898 million excl. deferred tax liabilities EUR 228 million
2003
Net operating capital 8,071 3,671 464 (82) 1,521 2,676 150 (329)
Eliminate liabilities comprised in NOC:
- payables/liabilities 7,672 1,427 317 2,017 656 920 1,051 1,284
- intercompany accounts – 24 4 77 11 (7) (67) (42)
- provisions1) 2,768 257 55 338 134 234 650 1,100
Include assets not comprised in NOC:
- investments in unconsolidated comp. 4,841 41 20 19 1,954 2,742 65
- other non-current financial assets 1,213 1,213
- deferred tax assets 1,774 1,774
- liquid assets 3,072 3,072
Total assets 29,411 5,420 840 2,370 2,341 5,777 4,526 8,137
1) provisions on balance sheet EUR 2,925 million excl. deferred tax liabilities EUR 157 million
2002
Net operating capital 10,539 4,849 529 46 1,723 3,814 (181) (241)
Eliminate liabilities comprised in NOC:
- payables/liabilities 7,836 1,600 361 2,056 692 970 916 1,241
- intercompany accounts – 6 6 57 15 (58) (31) 5
- provisions1) 3,162 280 65 431 159 268 827 1,132
Include assets not comprised in NOC:
- investments in unconsolidated comp. 6,089 45 19 19 2,400 3,578 28
- other non-current financial assets 1,306 1,306
- deferred tax assets 1,499 1,499
- liquid assets 1,858 1,858
Total assets 32,289 6,780 961 2,609 2,608 7,394 5,109 6,828
1) provisions on balance sheet EUR 3,246 million excl. deferred tax liabilities EUR 84 million
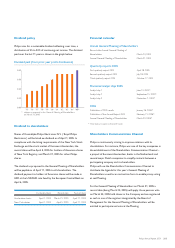
Composition of cash flow before financing activities
2002 2003 2004
Cash flow from operating activities 2,228 1,992 2,697
Cash flow from investing activities (248) 742 653
Cash flow before financing activities 1,980 2,734 3,350
211Philips Annual Report 2004