Philips 2004 Annual Report Download - page 141
Download and view the complete annual report
Please find page 141 of the 2004 Philips annual report below. You can navigate through the pages in the report by either clicking on the pages listed below, or by using the keyword search tool below to find specific information within the annual report.-
 1
1 -
2
-
3
-
4
-
5
-
6
-
7
-
8
-
9
-
10
-
11
-
12
-
13
-
14
-
15
-
16
-
17
-
18
-
19
-
20
-
21
-
22
-
23
-
24
-
25
-
26
-
27
-
28
-
29
-
30
-
31
-
32
-
33
-
34
-
35
-
36
-
37
-
38
-
39
-
40
-
41
-
42
-
43
-
44
-
45
-
46
-
47
-
48
-
49
-
50
-
51
-
52
-
53
-
54
-
55
-
56
-
57
-
58
-
59
-
60
-
61
-
62
-
63
-
64
-
65
-
66
-
67
-
68
-
69
-
70
-
71
-
72
-
73
-
74
-
75
-
76
-
77
-
78
-
79
-
80
-
81
-
82
-
83
-
84
-
85
-
86
-
87
-
88
-
89
-
90
-
91
-
92
-
93
-
94
-
95
-
96
-
97
-
98
-
99
-
100
-
101
-
102
-
103
-
104
-
105
-
106
-
107
-
108
-
109
-
110
-
111
-
112
-
113
-
114
-
115
-
116
-
117
-
118
-
119
-
120
-
121
-
122
-
123
-
124
-
125
-
126
-
127
-
128
-
129
-
130
-
 131
131 -
 132
132 -
 133
133 -
 134
134 -
 135
135 -
 136
136 -
 137
137 -
 138
138 -
 139
139 -
 140
140 -
 141
141 -
 142
142 -
 143
143 -
 144
144 -
 145
145 -
 146
146 -
 147
147 -
 148
148 -
 149
149 -
 150
150 -
 151
151 -
152
-
153
-
154
-
155
-
156
-
157
-
158
-
159
-
160
-
161
-
162
-
163
-
164
-
165
-
166
-
167
-
168
-
169
-
170
-
171
-
172
-
173
-
174
-
175
-
176
-
177
-
178
-
179
-
180
-
181
-
182
-
183
-
184
-
185
-
186
-
187
-
188
-
189
-
190
-
191
-
192
-
193
-
194
-
195
-
196
-
197
-
198
-
199
-
200
-
201
-
202
-
203
-
204
-
205
-
206
-
207
-
208
-
209
-
210
-
211
-
212
-
213
-
214
-
215
-
216
-
217
-
218
-
219
 |
 |

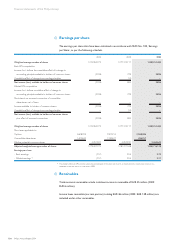
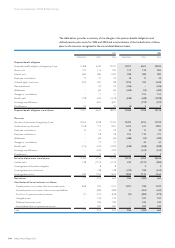
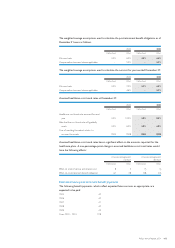
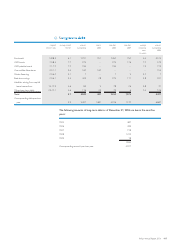
The table below provides a summary of the changes in the pension benefit obligations and
defined pension plan assets for 2004 and 2003 and a reconciliation of the funded status of these
plans to the amounts recognized in the consolidated balance sheets:
2003 2004
Netherlands Other Total Netherlands Other Total
Projected benefit obligation
Projected benefit obligation at beginning of year 12,468 6,769 19,237 12,357 6,567 18,924
Service cost 229 116 345 175 128 303
Interest cost 683 384 1,067 598 386 984
Employee contributions 19 10 29 18 11 29
Actuarial (gains) and losses (304) 392 88 1,226 412 1,638
Plan amendments – (10) (10) (766) – (766)
Settlements – (64) (64) (468) (14) (482)
Changes in consolidation – 11 11 – 152 152
Benefits paid (728) (400) (1,128) (638) (440) (1,078)
Exchange rate differences – (641) (641) – (197) (197)
Miscellaneous (10)–(10) (2)5 3
Projected benefit obligation at end of year 12,357 6,567 18,924 12,500 7,010 19,510
Plan assets
Fair value of plan assets at beginning of year 12,064 5,338 17,402 12,495 5,254 17,749
Actual return on plan assets 1,128 773 1,901 1,474 617 2,091
Employee contributions 19 10 29 18 11 29
Employer contributions – 58 58 252 119 371
Settlements – (64) (64) (480) (14) (494)
Changes in consolidation – 12 12 –4444
Benefits paid (716) (343) (1,059) (630) (368) (998)
Exchange rate differences – (540) (540) – (167) (167)
Miscellaneous – 10 10 – 3 3
Fair value of plan assets at end of year 12,495 5,254 17,749 13,129 5,499 18,628
Funded status 138 (1,313) (1,175) 629 (1,511) (882)
Unrecognized net transition obligation – 8 8 – 33
Unrecognized prior service cost – 138 138 (723) 108 (615)
Unrecognized net loss 639 1,015 1,654 1,050 1,113 2,163
Net balances 777 (152) 625 956 (287) 669
Classification of the net balances is as follows:
- Prepaid pension costs under other non-current assets 848 304 1,152 1,031 298 1,329
- Accrued pension costs under other non-current liabilities – (389) (389) – (451) (451)
- Provisions for pensions under provisions (71) (747) (818) (75) (904) (979)
- Intangible assets – 135 135 – 107 107
- Deferred income tax assets – 183 183 – 234 234
- Accumulated other comprehensive income – 362 362 – 429 429
Total 777 (152) 625 956 (287) 669
140 Philips Annual Report 2004
Financial statements of the Philips Group