Philips 2004 Annual Report Download - page 144
Download and view the complete annual report
Please find page 144 of the 2004 Philips annual report below. You can navigate through the pages in the report by either clicking on the pages listed below, or by using the keyword search tool below to find specific information within the annual report.-
 1
1 -
2
-
3
-
4
-
5
-
6
-
7
-
8
-
9
-
10
-
11
-
12
-
13
-
14
-
15
-
16
-
17
-
18
-
19
-
20
-
21
-
22
-
23
-
24
-
25
-
26
-
27
-
28
-
29
-
30
-
31
-
32
-
33
-
34
-
35
-
36
-
37
-
38
-
39
-
40
-
41
-
42
-
43
-
44
-
45
-
46
-
47
-
48
-
49
-
50
-
51
-
52
-
53
-
54
-
55
-
56
-
57
-
58
-
59
-
60
-
61
-
62
-
63
-
64
-
65
-
66
-
67
-
68
-
69
-
70
-
71
-
72
-
73
-
74
-
75
-
76
-
77
-
78
-
79
-
80
-
81
-
82
-
83
-
84
-
85
-
86
-
87
-
88
-
89
-
90
-
91
-
92
-
93
-
94
-
95
-
96
-
97
-
98
-
99
-
100
-
101
-
102
-
103
-
104
-
105
-
106
-
107
-
108
-
109
-
110
-
111
-
112
-
113
-
114
-
115
-
116
-
117
-
118
-
119
-
120
-
121
-
122
-
123
-
124
-
125
-
126
-
127
-
128
-
129
-
130
-
131
-
132
-
133
-
 134
134 -
 135
135 -
 136
136 -
 137
137 -
 138
138 -
 139
139 -
 140
140 -
 141
141 -
 142
142 -
 143
143 -
 144
144 -
 145
145 -
 146
146 -
 147
147 -
 148
148 -
 149
149 -
 150
150 -
 151
151 -
 152
152 -
 153
153 -
 154
154 -
155
-
156
-
157
-
158
-
159
-
160
-
161
-
162
-
163
-
164
-
165
-
166
-
167
-
168
-
169
-
170
-
171
-
172
-
173
-
174
-
175
-
176
-
177
-
178
-
179
-
180
-
181
-
182
-
183
-
184
-
185
-
186
-
187
-
188
-
189
-
190
-
191
-
192
-
193
-
194
-
195
-
196
-
197
-
198
-
199
-
200
-
201
-
202
-
203
-
204
-
205
-
206
-
207
-
208
-
209
-
210
-
211
-
212
-
213
-
214
-
215
-
216
-
217
-
218
-
219
 |
 |

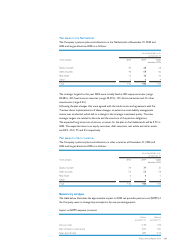
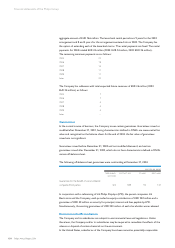
Plan assets in the Netherlands
The Company’s pension plan asset allocation in the Netherlands at December 31, 2003 and
2004 and target allocation 2005 is as follows:
percentage of plan assets
at December 31
Asset category 2003 2004 target
allocation 2005
Equity securities 40 28 26
Debt securities 46 59 60
Real estate 12 10 10
Other 234
Total 100 100 100
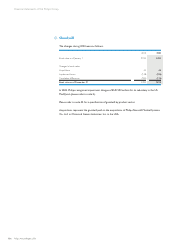
The strategic targets for the year 2004 were initially fixed at 38% equity securities (range
28-48%), 45% fixed income securities (range 39-59%), 14% direct real estate and 3% other
investments (range 0-5%).
Following the plan changes that were agreed with the trade unions and agreement with the
Trustees about implementation of these changes, an extensive asset-liability management
review was conducted, which led to a change in the strategic investment policy. The new
strategic targets are related to the size and the structure of the pension obligations.
The expected long-term rate of returns on assets for the plan in the Netherlands will be 5.7% in
2005. The expected returns on equity securities, debt securities, real estate and other assets
are 8.0%, 4.5%, 7% and 5% respectively.
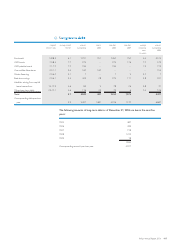
Plan assets in other countries
The Company’s pension plan asset allocation in other countries at December 31, 2003 and
2004 and target allocation 2005 is as follows:
percentage of plan assets
at December 31
Asset category 2003 2004 target
allocation 2005
Equity securities 39 37 35
Debt securities 53 53 56
Real estate 6 65
Other 244
Total 100 100 100
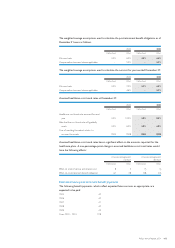
Sensitivity analysis
The table below illustrates the approximate impact on 2005 net periodic pension cost (NPPC) if
the Company were to change key assumptions by one-percentage-point.
Impact on NPPC expense (income):
increase
assumption 1%
decrease
assumption 1%
Discount rate (139) 193
Rate of return on plan assets (181) 181
Salary growth rate 285 (224)
143Philips Annual Report 2004