Philips 2004 Annual Report Download - page 65
Download and view the complete annual report
Please find page 65 of the 2004 Philips annual report below. You can navigate through the pages in the report by either clicking on the pages listed below, or by using the keyword search tool below to find specific information within the annual report.-
 1
1 -
2
-
3
-
4
-
5
-
6
-
7
-
8
-
9
-
10
-
11
-
12
-
13
-
14
-
15
-
16
-
17
-
18
-
19
-
20
-
21
-
22
-
23
-
24
-
25
-
26
-
27
-
28
-
29
-
30
-
31
-
32
-
33
-
34
-
35
-
36
-
37
-
38
-
39
-
40
-
41
-
42
-
43
-
44
-
45
-
46
-
47
-
48
-
49
-
50
-
51
-
52
-
53
-
54
-
 55
55 -
 56
56 -
 57
57 -
 58
58 -
 59
59 -
 60
60 -
 61
61 -
 62
62 -
 63
63 -
 64
64 -
 65
65 -
 66
66 -
 67
67 -
 68
68 -
 69
69 -
 70
70 -
 71
71 -
 72
72 -
 73
73 -
 74
74 -
 75
75 -
76
-
77
-
78
-
79
-
80
-
81
-
82
-
83
-
84
-
85
-
86
-
87
-
88
-
89
-
90
-
91
-
92
-
93
-
94
-
95
-
96
-
97
-
98
-
99
-
100
-
101
-
102
-
103
-
104
-
105
-
106
-
107
-
108
-
109
-
110
-
111
-
112
-
113
-
114
-
115
-
116
-
117
-
118
-
119
-
120
-
121
-
122
-
123
-
124
-
125
-
126
-
127
-
128
-
129
-
130
-
131
-
132
-
133
-
134
-
135
-
136
-
137
-
138
-
139
-
140
-
141
-
142
-
143
-
144
-
145
-
146
-
147
-
148
-
149
-
150
-
151
-
152
-
153
-
154
-
155
-
156
-
157
-
158
-
159
-
160
-
161
-
162
-
163
-
164
-
165
-
166
-
167
-
168
-
169
-
170
-
171
-
172
-
173
-
174
-
175
-
176
-
177
-
178
-
179
-
180
-
181
-
182
-
183
-
184
-
185
-
186
-
187
-
188
-
189
-
190
-
191
-
192
-
193
-
194
-
195
-
196
-
197
-
198
-
199
-
200
-
201
-
202
-
203
-
204
-
205
-
206
-
207
-
208
-
209
-
210
-
211
-
212
-
213
-
214
-
215
-
216
-
217
-
218
-
219
 |
 |

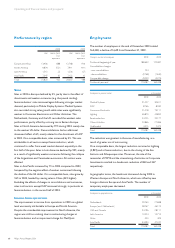
Comparable sales growth was 3% in 2003. Oral Healthcare
showed strong growth of 24%, and Food & Beverage set the pace
for the industry with its 6% growth, both on a comparable basis.
Profitability, measured as income from operations as a percentage
of sales, increased from 17.6% in 2002 to 18.7% in 2003. Higher
margins and strict cost control enabled higher profitability despite
lower nominal sales. Continued focus on asset management led to
a lower net operating capital and strong cash flow.
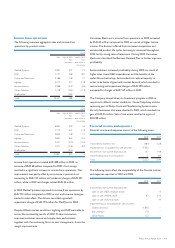
Consumer Electronics
2002 2003
Sales 9,855 9,188
% nominal (decrease) (7) (7)
% comparable (decrease) increase (4) 2
Income from operations 208 248
asa%ofsales 2.1 2.7
Net operating capital 46 (82)
Employees (FTEs) 21,018 19,111
See pages 210 and 211 for a reconciliation to the most directly comparable US GAAP measures.
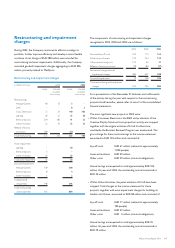
Comparable sales in 2003 were up slightly (2%) after years of
decline, and in line with market growth. Nominal sales were
heavily impacted by the lower US dollar. Growth was strong in
Asia Pacific (17%) in 2003. The second half of 2003 saw growth,
with Television, LCD Monitors, DVD and GSM in particular
posting improved results.
Generally, margins were under pressure, especially in the first half
of 2003. Innovative new products helped Television to increase
margins during 2003. Income from operations excluding Licenses
amounted to a loss of EUR 49 million. Net restructuring charges
totaled EUR 58 million, and mainly related to Television (Dreux)
and Monitors.
At the end of 2003 working capital was negative for the first time
in the division’s history.
Driven by past-use payments of EUR 121 million, Licenses’ income
increased to EUR 297 million. CD-R/RW and DVD programs
were the main contributors to Licenses’ income.
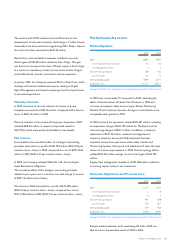
Lighting
2002 2003
Sales 4,845 4,522
% nominal (decrease) (5) (7)
% comparable (decrease) increase (2) 2
Income from operations 602 577
asa%ofsales 12.4 12.8
Net operating capital 1,723 1,521
Employees (FTEs) 46,870 43,800
See pages 210 and 211 for a reconciliation to the most directly comparable US GAAP measures.
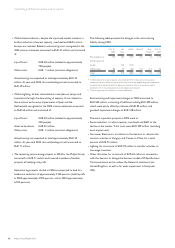
Despite the generally weaker markets, comparable sales increased
by 2% during 2003, fueled by increases at Automotive & Special
Lighting and Lighting Electronics. Sales in Asia Pacific and North
America rose and European levels recovered during 2003, while
demand in Latin America remained weak.
Income from operations for 2003 amounted to EUR 577 million,
compared to EUR 602 million in 2002. Despite the decline, income
from operations as a percentage of sales increased from 12.4% in
2002 to 12.8% in 2003, as a result of an increased focus on
marketing management, tight cost control and increasing volumes
in high-end products. Net restructuring charges of EUR 27 million
mainly related to projects in India, Canada and Venezuela.
The Lumileds venture, an unconsolidated company, achieved
substantial increases in sales and posted an operating profit.
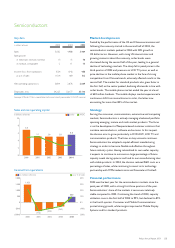
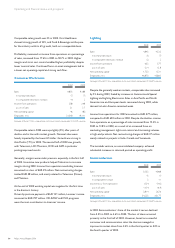
Semiconductors
2002 2003
Sales 5,032 4,988
% nominal (decrease) (1) (1)
% comparable increase 2 11
Income (loss) from operations (524) (342)
asa%ofsales (10.4) (6.9)
Net operating capital 3,814 2,676
Employees (FTEs) 34,225 33,177
See pages 210 and 211 for a reconciliation to the most directly comparable US GAAP measures.
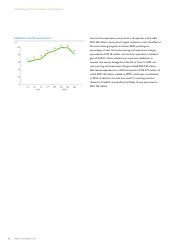
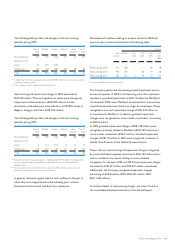
In 2003, Semiconductors’ share of the market it serves declined
from 5.3% in 2002 to 4.6% in 2003. The loss of share occurred
primarily in the first half of 2003. However, based on successful
consumer and communication sales, the division managed to
improve its market share from 4.5% in the third quarter to 5.0% in
the fourth quarter of 2003.
64 Philips Annual Report 2004
Operating and financial review and prospects