Philips 2004 Annual Report Download - page 123
Download and view the complete annual report
Please find page 123 of the 2004 Philips annual report below. You can navigate through the pages in the report by either clicking on the pages listed below, or by using the keyword search tool below to find specific information within the annual report.-
 1
1 -
2
-
3
-
4
-
5
-
6
-
7
-
8
-
9
-
10
-
11
-
12
-
13
-
14
-
15
-
16
-
17
-
18
-
19
-
20
-
21
-
22
-
23
-
24
-
25
-
26
-
27
-
28
-
29
-
30
-
31
-
32
-
33
-
34
-
35
-
36
-
37
-
38
-
39
-
40
-
41
-
42
-
43
-
44
-
45
-
46
-
47
-
48
-
49
-
50
-
51
-
52
-
53
-
54
-
55
-
56
-
57
-
58
-
59
-
60
-
61
-
62
-
63
-
64
-
65
-
66
-
67
-
68
-
69
-
70
-
71
-
72
-
73
-
74
-
75
-
76
-
77
-
78
-
79
-
80
-
81
-
82
-
83
-
84
-
85
-
86
-
87
-
88
-
89
-
90
-
91
-
92
-
93
-
94
-
95
-
96
-
97
-
98
-
99
-
100
-
101
-
102
-
103
-
104
-
105
-
106
-
107
-
108
-
109
-
110
-
111
-
112
-
 113
113 -
 114
114 -
 115
115 -
 116
116 -
 117
117 -
 118
118 -
 119
119 -
 120
120 -
 121
121 -
 122
122 -
 123
123 -
 124
124 -
 125
125 -
 126
126 -
 127
127 -
 128
128 -
 129
129 -
 130
130 -
 131
131 -
 132
132 -
 133
133 -
134
-
135
-
136
-
137
-
138
-
139
-
140
-
141
-
142
-
143
-
144
-
145
-
146
-
147
-
148
-
149
-
150
-
151
-
152
-
153
-
154
-
155
-
156
-
157
-
158
-
159
-
160
-
161
-
162
-
163
-
164
-
165
-
166
-
167
-
168
-
169
-
170
-
171
-
172
-
173
-
174
-
175
-
176
-
177
-
178
-
179
-
180
-
181
-
182
-
183
-
184
-
185
-
186
-
187
-
188
-
189
-
190
-
191
-
192
-
193
-
194
-
195
-
196
-
197
-
198
-
199
-
200
-
201
-
202
-
203
-
204
-
205
-
206
-
207
-
208
-
209
-
210
-
211
-
212
-
213
-
214
-
215
-
216
-
217
-
218
-
219
 |
 |

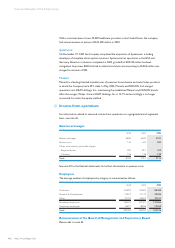
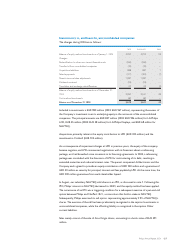
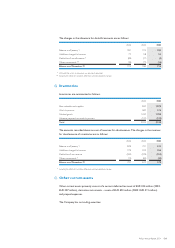
Deferred tax assets and liabilities
Deferred tax assets and liabilities relate to the following balance sheet captions:
2003 2004
assets liabilities assets liabilities
Intangible assets 170 (190) 130 (210)
Property, plant and equipment 210 (110) 130 (100)
Inventories 130 (30) 140 (30)
Receivables 270 (20) 260 (30)
Other assets 200 (390) 210 (450)
Provisions:
- Pensions 80 (10) 220 (10)
- Restructuring 50 – 30 –
- Guarantees 50 – 20 –
- Termination benefits 40 – 80 –
- Other postretirement benefits 80 – 90 –
- Other 460 (10) 370 (10)
Other liabilities 180 (88) 120 (49)
Total deferred tax assets/liabilities 1,920 (848) 1,800 (889)
Net deferred tax position 1,072 911
Tax loss carryforwards (including tax credit
carryforwards) 1,610 1,553
Valuation allowances (1,065)(895)
Net deferred tax assets 1,617 1,569
In assessing the realizability of deferred tax assets, management considers whether it is more
likely than not that some portion or all of the deferred tax assets will not be realized. The
ultimate realization of deferred tax assets is dependent upon the generation of future taxable
income during the periods in which those temporary differences become deductible.
Management considers the scheduled reversal of deferred tax liabilities, projected future
taxable income and tax strategies in making this assessment. In order to fully realize the
deferred tax asset, the Company will need to generate future taxable income in the countries
where the net operating losses were incurred. Based upon the level of historical taxable income
and projections for future taxable income over the periods in which the deferred tax assets are
deductible, management believes it is more likely than not that the Company will realize the
benefits of these deductible differences, net of the existing valuation allowance at December 31,
2004.
The valuation allowance for deferred tax assets as of December 31, 2004 and 2003 was
EUR 895 million and EUR 1,065 million respectively. The net change in the total valuation
allowance for the years ended December 31, 2004, 2003 and 2002 were decreases of EUR 170
million, EUR 184 million and EUR 9 million respectively.
122 Philips Annual Report 2004
Financial statements of the Philips Group