Philips 2004 Annual Report Download - page 119
Download and view the complete annual report
Please find page 119 of the 2004 Philips annual report below. You can navigate through the pages in the report by either clicking on the pages listed below, or by using the keyword search tool below to find specific information within the annual report.-
 1
1 -
2
-
3
-
4
-
5
-
6
-
7
-
8
-
9
-
10
-
11
-
12
-
13
-
14
-
15
-
16
-
17
-
18
-
19
-
20
-
21
-
22
-
23
-
24
-
25
-
26
-
27
-
28
-
29
-
30
-
31
-
32
-
33
-
34
-
35
-
36
-
37
-
38
-
39
-
40
-
41
-
42
-
43
-
44
-
45
-
46
-
47
-
48
-
49
-
50
-
51
-
52
-
53
-
54
-
55
-
56
-
57
-
58
-
59
-
60
-
61
-
62
-
63
-
64
-
65
-
66
-
67
-
68
-
69
-
70
-
71
-
72
-
73
-
74
-
75
-
76
-
77
-
78
-
79
-
80
-
81
-
82
-
83
-
84
-
85
-
86
-
87
-
88
-
89
-
90
-
91
-
92
-
93
-
94
-
95
-
96
-
97
-
98
-
99
-
100
-
101
-
102
-
103
-
104
-
105
-
106
-
107
-
108
-
 109
109 -
 110
110 -
 111
111 -
 112
112 -
 113
113 -
 114
114 -
 115
115 -
 116
116 -
 117
117 -
 118
118 -
 119
119 -
 120
120 -
 121
121 -
 122
122 -
 123
123 -
 124
124 -
 125
125 -
 126
126 -
 127
127 -
 128
128 -
 129
129 -
130
-
131
-
132
-
133
-
134
-
135
-
136
-
137
-
138
-
139
-
140
-
141
-
142
-
143
-
144
-
145
-
146
-
147
-
148
-
149
-
150
-
151
-
152
-
153
-
154
-
155
-
156
-
157
-
158
-
159
-
160
-
161
-
162
-
163
-
164
-
165
-
166
-
167
-
168
-
169
-
170
-
171
-
172
-
173
-
174
-
175
-
176
-
177
-
178
-
179
-
180
-
181
-
182
-
183
-
184
-
185
-
186
-
187
-
188
-
189
-
190
-
191
-
192
-
193
-
194
-
195
-
196
-
197
-
198
-
199
-
200
-
201
-
202
-
203
-
204
-
205
-
206
-
207
-
208
-
209
-
210
-
211
-
212
-
213
-
214
-
215
-
216
-
217
-
218
-
219
 |
 |

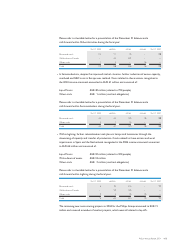
Additions of EUR 490 million are presented by sector as follows:
personnel write- other total
costs down costs
of assets
Medical Systems 14 – 4 18
DAP ––––
Consumer Electronics 58 10 4 72
Lighting 20 5 4 29
Semiconductors 50 209 50 309
Other Activities 31 30 1 62
Total 173 254 63 490
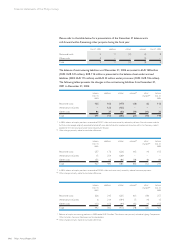
The movements in the provision for restructuring costs in 2002 are presented by sector as
follows:
balance additions utilized released other balance
Dec. 31, changes Dec. 31,
2001 2002
Medical Systems 116 28 (93) (4) (6) 41
DAP 1 9 (4) – – 6
Consumer Electronics 121 88 (110) (14) (1) 84
Lighting 16 20 (11) (7) (2) 16
Semiconductors 48 178 (133) (11) (6) 76
Other Activities 139 239 (122) (42) (11) 203
Unallocated 1 – – – – 1
Total 442 562 (473) (78) (26) 427
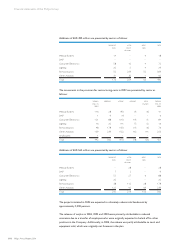
Additions of EUR 562 million are presented by sector as follows:
personnel write- other total
costs down costs
of assets
Medical Systems – 28 – 28
DAP 7 2 – 9
Consumer Electronics 55 27 6 88
Lighting 20 – – 20
Semiconductors 38 112 28 178
Other Activities 125 45 69 239
Total 245 214 103 562
The projects initiated in 2004 are expected to ultimately reduce total headcount by
approximately 2,200 persons.
The releases of surplus in 2004, 2003 and 2002 were primarily attributable to reduced
severance due to a transfer of employees who were originally expected to be laid off to other
positions in the Company. Additionally, in 2004, the release was partly attributable to tools and
equipment sold, which was originally not foreseen in the plan.
118 Philips Annual Report 2004
Financial statements of the Philips Group