Philips 2004 Annual Report Download - page 129
Download and view the complete annual report
Please find page 129 of the 2004 Philips annual report below. You can navigate through the pages in the report by either clicking on the pages listed below, or by using the keyword search tool below to find specific information within the annual report.-
 1
1 -
2
-
3
-
4
-
5
-
6
-
7
-
8
-
9
-
10
-
11
-
12
-
13
-
14
-
15
-
16
-
17
-
18
-
19
-
20
-
21
-
22
-
23
-
24
-
25
-
26
-
27
-
28
-
29
-
30
-
31
-
32
-
33
-
34
-
35
-
36
-
37
-
38
-
39
-
40
-
41
-
42
-
43
-
44
-
45
-
46
-
47
-
48
-
49
-
50
-
51
-
52
-
53
-
54
-
55
-
56
-
57
-
58
-
59
-
60
-
61
-
62
-
63
-
64
-
65
-
66
-
67
-
68
-
69
-
70
-
71
-
72
-
73
-
74
-
75
-
76
-
77
-
78
-
79
-
80
-
81
-
82
-
83
-
84
-
85
-
86
-
87
-
88
-
89
-
90
-
91
-
92
-
93
-
94
-
95
-
96
-
97
-
98
-
99
-
100
-
101
-
102
-
103
-
104
-
105
-
106
-
107
-
108
-
109
-
110
-
111
-
112
-
113
-
114
-
115
-
116
-
117
-
118
-
 119
119 -
 120
120 -
 121
121 -
 122
122 -
 123
123 -
 124
124 -
 125
125 -
 126
126 -
 127
127 -
 128
128 -
 129
129 -
 130
130 -
 131
131 -
 132
132 -
 133
133 -
 134
134 -
 135
135 -
 136
136 -
 137
137 -
 138
138 -
 139
139 -
140
-
141
-
142
-
143
-
144
-
145
-
146
-
147
-
148
-
149
-
150
-
151
-
152
-
153
-
154
-
155
-
156
-
157
-
158
-
159
-
160
-
161
-
162
-
163
-
164
-
165
-
166
-
167
-
168
-
169
-
170
-
171
-
172
-
173
-
174
-
175
-
176
-
177
-
178
-
179
-
180
-
181
-
182
-
183
-
184
-
185
-
186
-
187
-
188
-
189
-
190
-
191
-
192
-
193
-
194
-
195
-
196
-
197
-
198
-
199
-
200
-
201
-
202
-
203
-
204
-
205
-
206
-
207
-
208
-
209
-
210
-
211
-
212
-
213
-
214
-
215
-
216
-
217
-
218
-
219
 |
 |

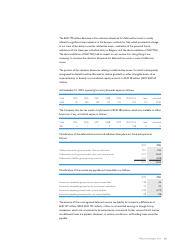
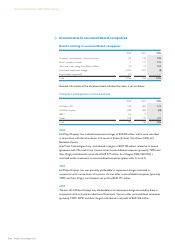
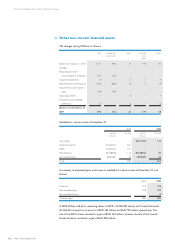
The total carrying value of investments in, and loans to, unconsolidated companies is
summarized as follows:
2003 2004
shareholding % amount shareholding % amount
LG.Philips Displays 50 27 50 155
LG.Philips LCD 50 1,879 45 2,714
Taiwan Semiconductor Manufacturing Co. 19 1,595 19 1,864
Atos Origin 45 560 ––
NAVTEQ – – 35 132
Other equity method investments 701 725
4,762 5,590
Total cost method investments 79 80
Total 4,841 5,670
The fair value of Philips’ shareholdings in the publicly listed companies TSMC, LG.Philips LCD
and NAVTEQ, based on quoted market prices at December 31, 2004, is EUR 5,126 million,
EUR 3,992 million and EUR 1,040 million respectively.
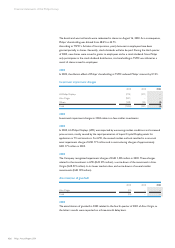
Summarized financial information for the Company’s equity investments in
unconsolidated companies on a combined basis is presented below:
January-December
2002 2003 2004
Net sales 16,742 17,439 17,349
Income before taxes 667 1,176 3,212
Income taxes (274) (118) (122)
Income after taxes 393 1,058 3,090
Net income 140 1,034 3,132
Total share in net income of unconsolidated companies
recognized in the consolidated statements of income (10) 169 983
December 31,
2003 2004
Current assets 8,523 8,766
Non-current assets 14,378 15,826
22,901 24,592
Current liabilities (6,874) (5,455)
Non-current liabilities (3,389)(3,481)
Net asset value 12,638 15,656
Investments in and loans to unconsolidated companies included in the
consolidated balance sheet 4,762 5,590
128 Philips Annual Report 2004
Financial statements of the Philips Group