Philips 2004 Annual Report Download - page 215
Download and view the complete annual report
Please find page 215 of the 2004 Philips annual report below. You can navigate through the pages in the report by either clicking on the pages listed below, or by using the keyword search tool below to find specific information within the annual report.-
 1
1 -
2
-
3
-
4
-
5
-
6
-
7
-
8
-
9
-
10
-
11
-
12
-
13
-
14
-
15
-
16
-
17
-
18
-
19
-
20
-
21
-
22
-
23
-
24
-
25
-
26
-
27
-
28
-
29
-
30
-
31
-
32
-
33
-
34
-
35
-
36
-
37
-
38
-
39
-
40
-
41
-
42
-
43
-
44
-
45
-
46
-
47
-
48
-
49
-
50
-
51
-
52
-
53
-
54
-
55
-
56
-
57
-
58
-
59
-
60
-
61
-
62
-
63
-
64
-
65
-
66
-
67
-
68
-
69
-
70
-
71
-
72
-
73
-
74
-
75
-
76
-
77
-
78
-
79
-
80
-
81
-
82
-
83
-
84
-
85
-
86
-
87
-
88
-
89
-
90
-
91
-
92
-
93
-
94
-
95
-
96
-
97
-
98
-
99
-
100
-
101
-
102
-
103
-
104
-
105
-
106
-
107
-
108
-
109
-
110
-
111
-
112
-
113
-
114
-
115
-
116
-
117
-
118
-
119
-
120
-
121
-
122
-
123
-
124
-
125
-
126
-
127
-
128
-
129
-
130
-
131
-
132
-
133
-
134
-
135
-
136
-
137
-
138
-
139
-
140
-
141
-
142
-
143
-
144
-
145
-
146
-
147
-
148
-
149
-
150
-
151
-
152
-
153
-
154
-
155
-
156
-
157
-
158
-
159
-
160
-
161
-
162
-
163
-
164
-
165
-
166
-
167
-
168
-
169
-
170
-
171
-
172
-
173
-
174
-
175
-
176
-
177
-
178
-
179
-
180
-
181
-
182
-
183
-
184
-
185
-
186
-
187
-
188
-
189
-
190
-
191
-
192
-
193
-
194
-
195
-
196
-
197
-
198
-
199
-
200
-
201
-
202
-
203
-
204
-
 205
205 -
 206
206 -
 207
207 -
 208
208 -
 209
209 -
 210
210 -
 211
211 -
 212
212 -
 213
213 -
 214
214 -
 215
215 -
 216
216 -
 217
217 -
 218
218 -
 219
219
 |
 |

Detailed information for shareholders is available on our website
www.philips.com/investor. As well as financial reports and
presentations, the site also provides information on related issues,
such as governance, business ethics and sustainability.
Shareholders are also welcome to visit our website
www.philips.com, which provides extensive information about the
Philips Group.
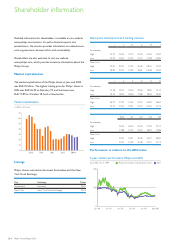
Market capitalization
The market capitalization of the Philips shares at year-end 2004
was EUR 25 billion. The highest trading price for Philips’ shares in
2004 was EUR 26.20 on February 19, and the lowest was
EUR 17.89 on October 18, both in Amsterdam.
Market capitalization
in billions of euros
0
10
20
30
40
50
60
70
2000 2001 2002 2003 2004
Listings
Philips’ shares are listed on Euronext Amsterdam and the New
York Stock Exchange.
City Exchange Ticker
Amsterdam Euronext PHIA
New York New York Stock Exchange PHG
Share price development and trading volumes
J F M A M J
Amsterdam
High 25.73 26.20 25.23 25.18 23.36 22.67
Low 23.53 24.07 22.03 22.72 21.08 20.90
New York
High 32.02 33.31 31.03 30.49 28.41 27.97
Low 29.87 30.07 27.09 26.81 25.08 25.65
J A S O N D
Amsterdam
High 22.18 19.77 20.04 19.56 19.90 20.12
Low 19.45 18.03 18.44 17.89 18.76 19.30
New York
High 26.75 21.97 24.43 24.20 26.09 26.81
Low 23.73 24.13 22.91 22.23 23.94 25.74
2004 Q1 Q2 Q3 Q4
Amsterdam
High 26.20 26.20 25.18 22.18 20.12
Low 17.89 22.03 20.90 18.03 17.89
New York
High 33.31 33.31 30.49 26.75 26.81
Low 22.91 27.09 25.08 22.91 22.23
Performance in relation to the AEX index
5-year relative performance: Philips and AEX
0
100
200
base 100 = Jan 4, 1999
Jan '00 Jan '01 Jan '02 Jan '03 Jan '04 Jan '05
Philips Amsterdam Closing Share Price AEX
214 Philips Annual Report 2004
Shareholder information