Philips 2004 Annual Report Download - page 53
Download and view the complete annual report
Please find page 53 of the 2004 Philips annual report below. You can navigate through the pages in the report by either clicking on the pages listed below, or by using the keyword search tool below to find specific information within the annual report.-
 1
1 -
2
-
3
-
4
-
5
-
6
-
7
-
8
-
9
-
10
-
11
-
12
-
13
-
14
-
15
-
16
-
17
-
18
-
19
-
20
-
21
-
22
-
23
-
24
-
25
-
26
-
27
-
28
-
29
-
30
-
31
-
32
-
33
-
34
-
35
-
36
-
37
-
38
-
39
-
40
-
41
-
42
-
 43
43 -
 44
44 -
 45
45 -
 46
46 -
 47
47 -
 48
48 -
 49
49 -
 50
50 -
 51
51 -
 52
52 -
 53
53 -
 54
54 -
 55
55 -
 56
56 -
 57
57 -
 58
58 -
 59
59 -
 60
60 -
 61
61 -
 62
62 -
 63
63 -
64
-
65
-
66
-
67
-
68
-
69
-
70
-
71
-
72
-
73
-
74
-
75
-
76
-
77
-
78
-
79
-
80
-
81
-
82
-
83
-
84
-
85
-
86
-
87
-
88
-
89
-
90
-
91
-
92
-
93
-
94
-
95
-
96
-
97
-
98
-
99
-
100
-
101
-
102
-
103
-
104
-
105
-
106
-
107
-
108
-
109
-
110
-
111
-
112
-
113
-
114
-
115
-
116
-
117
-
118
-
119
-
120
-
121
-
122
-
123
-
124
-
125
-
126
-
127
-
128
-
129
-
130
-
131
-
132
-
133
-
134
-
135
-
136
-
137
-
138
-
139
-
140
-
141
-
142
-
143
-
144
-
145
-
146
-
147
-
148
-
149
-
150
-
151
-
152
-
153
-
154
-
155
-
156
-
157
-
158
-
159
-
160
-
161
-
162
-
163
-
164
-
165
-
166
-
167
-
168
-
169
-
170
-
171
-
172
-
173
-
174
-
175
-
176
-
177
-
178
-
179
-
180
-
181
-
182
-
183
-
184
-
185
-
186
-
187
-
188
-
189
-
190
-
191
-
192
-
193
-
194
-
195
-
196
-
197
-
198
-
199
-
200
-
201
-
202
-
203
-
204
-
205
-
206
-
207
-
208
-
209
-
210
-
211
-
212
-
213
-
214
-
215
-
216
-
217
-
218
-
219
 |
 |

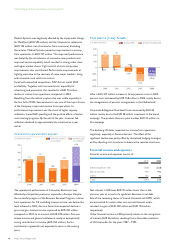
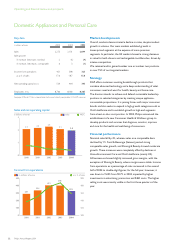
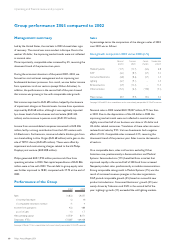
Domestic Appliances and Personal Care
Key data
in millions of euros 2002 2003 2004
Sales 2,273 2,131 2,044
Sales growth
% increase (decrease), nominal 2 (6) (4)
% increase, (decrease), comparable 6 3 (1)
Income from operations 401 398 323
asa%ofsales 17.6 18.7 15.8
Net operating capital (NOC) 529 464 393
Employees (FTEs) 8,766 8,180 8,205
See pages 210 and 211 for a reconciliation to the most directly comparable US GAAP measures.
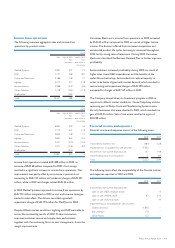
Sales and net operating capital
3
2
1
0
in billions of euros sales NOC
20042003200220012000
2.1
2.3
2.2
2.1 2.0
Income from operations
500
200
300
400
100
0
20%
18%
16%
14%
12%
10%
in millions of euros as a % of sales
20042003200220012000
398
401
334
287
323
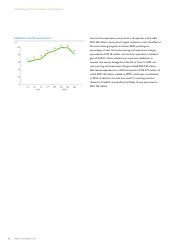
Market developments
Overall, markets demonstrated a decline in value, despite modest
growth in volume. Our main markets exhibited growth in
lower-priced segments at the expense of more premium
segments. In particular, the US market showed a strong decrease
in value for both shavers and rechargeable toothbrushes, driven by
intense competition.
We retained and/or gained number one or number two positions
in over 75% of our targeted markets.
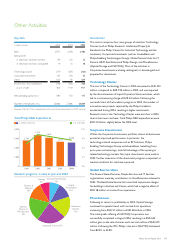
Strategy
DAP offers customers exciting breakthrough products that
combine advanced technology and a deep understanding of what
consumers need and want for health, beauty and home care.
The division intends to achieve and defend sustainable leadership
positions in selected categories by creating unique appliance-
consumable propositions. It is joining forces with major consumer
brands and also seeks to expand in high-growth categories such as
Oral Healthcare and to establish growth in high-end segments
from a best-in-class cost position. In 2004, Philips announced the
establishment of a new Consumer Health & Wellness group to
develop products and services that diagnose, monitor, improve
and care for the health and well-being of consumers.
Financial performance
Nominal sales fell by 4%, whereas sales on a comparable basis
declined by 1%. Food & Beverage (Senseo) posted strong
comparable sales growth, and Shaving & Beauty showed moderate
growth. These increases were completely offset by declines at
Home Environment Care and Oral Healthcare (mainly US).
All businesses showed slightly increased gross margins, with the
exception of Shaving & Beauty, where margins were stable. Income
from operations as a percentage of sales recovered in the second
half of 2004 to double-digit figures; for the full year, however, it
was down to 15.8% from 18.7% in 2003, impacted by higher
investments in advertising, promotion and R&D costs. The higher
selling costs were mainly visible in the first three quarters of the
year.
52 Philips Annual Report 2004
Operating and financial review and prospects