Philips 2004 Annual Report Download - page 82
Download and view the complete annual report
Please find page 82 of the 2004 Philips annual report below. You can navigate through the pages in the report by either clicking on the pages listed below, or by using the keyword search tool below to find specific information within the annual report.-
 1
1 -
2
-
3
-
4
-
5
-
6
-
7
-
8
-
9
-
10
-
11
-
12
-
13
-
14
-
15
-
16
-
17
-
18
-
19
-
20
-
21
-
22
-
23
-
24
-
25
-
26
-
27
-
28
-
29
-
30
-
31
-
32
-
33
-
34
-
35
-
36
-
37
-
38
-
39
-
40
-
41
-
42
-
43
-
44
-
45
-
46
-
47
-
48
-
49
-
50
-
51
-
52
-
53
-
54
-
55
-
56
-
57
-
58
-
59
-
60
-
61
-
62
-
63
-
64
-
65
-
66
-
67
-
68
-
69
-
70
-
71
-
 72
72 -
 73
73 -
 74
74 -
 75
75 -
 76
76 -
 77
77 -
 78
78 -
 79
79 -
 80
80 -
 81
81 -
 82
82 -
 83
83 -
 84
84 -
 85
85 -
 86
86 -
 87
87 -
 88
88 -
 89
89 -
 90
90 -
 91
91 -
 92
92 -
93
-
94
-
95
-
96
-
97
-
98
-
99
-
100
-
101
-
102
-
103
-
104
-
105
-
106
-
107
-
108
-
109
-
110
-
111
-
112
-
113
-
114
-
115
-
116
-
117
-
118
-
119
-
120
-
121
-
122
-
123
-
124
-
125
-
126
-
127
-
128
-
129
-
130
-
131
-
132
-
133
-
134
-
135
-
136
-
137
-
138
-
139
-
140
-
141
-
142
-
143
-
144
-
145
-
146
-
147
-
148
-
149
-
150
-
151
-
152
-
153
-
154
-
155
-
156
-
157
-
158
-
159
-
160
-
161
-
162
-
163
-
164
-
165
-
166
-
167
-
168
-
169
-
170
-
171
-
172
-
173
-
174
-
175
-
176
-
177
-
178
-
179
-
180
-
181
-
182
-
183
-
184
-
185
-
186
-
187
-
188
-
189
-
190
-
191
-
192
-
193
-
194
-
195
-
196
-
197
-
198
-
199
-
200
-
201
-
202
-
203
-
204
-
205
-
206
-
207
-
208
-
209
-
210
-
211
-
212
-
213
-
214
-
215
-
216
-
217
-
218
-
219
 |
 |

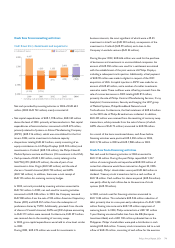
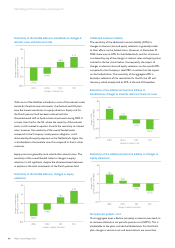
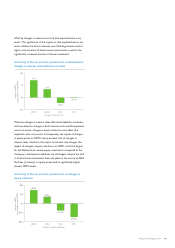
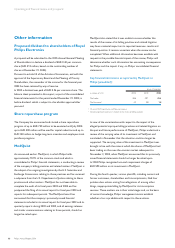
offset by changes in interest costs and (the expected return on)
assets. The significance of the impact on (the expected return on)
assets reflects the fund’s relatively sound funding situation and its
higher concentration of fixed-income investments as well as the
significantly increased duration of those investments.
Sensitivity of the net periodic pension cost to simultaneous
changes in interest rates and discount rates
1.0%0.5%(0.5%)(1.0%)
change in interest rate
change in NPPC
(compared to total NPPC)
(5%)
0%
5%
10%
(2.2%)
(0.1%)
7.1%
3.4%
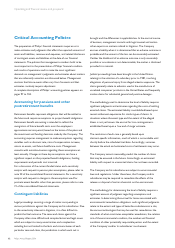
Whereas changes in interest rates affect both liabilities and assets,
and hence lead to changes in both interest costs and the expected
return on assets, changes in equity valuations only affect (the
expected return on) assets. Consequently, the impact of changes
in equity prices on NPPC clearly exceeds that of changes in
interest rates. Similar to the impact of interest rate changes, the
impact of changes in equity valuations on NPPC is still the largest
for the Netherlands, where equity investments compared to the
Company’s total pension liabilities are still largest, despite the shift
to fixed income investments that took place in the course of 2004.
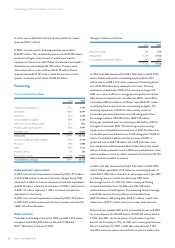
Declines (increases) in equity prices lead to significantly higher
(lower) NPPC levels.
Sensitivity of the net periodic pension cost to changes in
equity valutions
20%10%(10%)(20%)
change in equity valuations
change in NPPC
(compared to total NPPC)
80%
40%
0%
(40%)
(80%)
(30.1%)
(60.3%)
58.0%
29.8%
81Philips Annual Report 2004