Philips 2004 Annual Report Download - page 174
Download and view the complete annual report
Please find page 174 of the 2004 Philips annual report below. You can navigate through the pages in the report by either clicking on the pages listed below, or by using the keyword search tool below to find specific information within the annual report.-
 1
1 -
2
-
3
-
4
-
5
-
6
-
7
-
8
-
9
-
10
-
11
-
12
-
13
-
14
-
15
-
16
-
17
-
18
-
19
-
20
-
21
-
22
-
23
-
24
-
25
-
26
-
27
-
28
-
29
-
30
-
31
-
32
-
33
-
34
-
35
-
36
-
37
-
38
-
39
-
40
-
41
-
42
-
43
-
44
-
45
-
46
-
47
-
48
-
49
-
50
-
51
-
52
-
53
-
54
-
55
-
56
-
57
-
58
-
59
-
60
-
61
-
62
-
63
-
64
-
65
-
66
-
67
-
68
-
69
-
70
-
71
-
72
-
73
-
74
-
75
-
76
-
77
-
78
-
79
-
80
-
81
-
82
-
83
-
84
-
85
-
86
-
87
-
88
-
89
-
90
-
91
-
92
-
93
-
94
-
95
-
96
-
97
-
98
-
99
-
100
-
101
-
102
-
103
-
104
-
105
-
106
-
107
-
108
-
109
-
110
-
111
-
112
-
113
-
114
-
115
-
116
-
117
-
118
-
119
-
120
-
121
-
122
-
123
-
124
-
125
-
126
-
127
-
128
-
129
-
130
-
131
-
132
-
133
-
134
-
135
-
136
-
137
-
138
-
139
-
140
-
141
-
142
-
143
-
144
-
145
-
146
-
147
-
148
-
149
-
150
-
151
-
152
-
153
-
154
-
155
-
156
-
157
-
158
-
159
-
160
-
161
-
162
-
163
-
 164
164 -
 165
165 -
 166
166 -
 167
167 -
 168
168 -
 169
169 -
 170
170 -
 171
171 -
 172
172 -
 173
173 -
 174
174 -
 175
175 -
 176
176 -
 177
177 -
 178
178 -
 179
179 -
 180
180 -
 181
181 -
 182
182 -
 183
183 -
 184
184 -
185
-
186
-
187
-
188
-
189
-
190
-
191
-
192
-
193
-
194
-
195
-
196
-
197
-
198
-
199
-
200
-
201
-
202
-
203
-
204
-
205
-
206
-
207
-
208
-
209
-
210
-
211
-
212
-
213
-
214
-
215
-
216
-
217
-
218
-
219
 |
 |

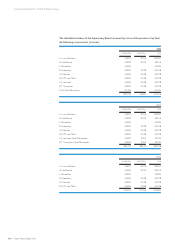
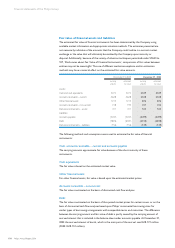
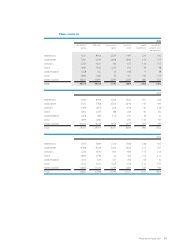
Product sectors
2004
sales (to income asa%of results
third (loss) from sales relating to
parties) operations unconsolidated
companies
Medical Systems 5,884 34 0.6 11
DAP 2,044 323 15.8 –
Consumer Electronics 9,919 361 3.6 1
Lighting 4,526 591 13.1 26
Semiconductors 5,464 450 8.2 (42)
Other Activities 2,482 366 14.7 1,426
Unallocated – (518)– –
Total 30,319 1,607 5.3 1,422
2003
Medical Systems 5,990 431 7.2 (2)
DAP 2,131 398 18.7 –
Consumer Electronics 9,188 248 2.7 1
Lighting 4,522 577 12.8 4
Semiconductors 4,988 (342) (6.9) 882
Other Activities 2,218 (263) (11.9) (372)
Unallocated – (561)– (7)
Total 29,037 488 1.7 506
2002
Medical Systems 6,844 309 4.5 (44)
DAP 2,273 401 17.6 –
Consumer Electronics 9,855 208 2.1 –
Lighting 4,845 602 12.4 (23)
Semiconductors 5,032 (524) (10.4) 75
Other Activities 2,971 (246) (8.3) (1,355)
Unallocated – (330)– 1
Total 31,820 420 1.3 (1,346)
173Philips Annual Report 2004