Philips 2004 Annual Report Download - page 70
Download and view the complete annual report
Please find page 70 of the 2004 Philips annual report below. You can navigate through the pages in the report by either clicking on the pages listed below, or by using the keyword search tool below to find specific information within the annual report.-
 1
1 -
2
-
3
-
4
-
5
-
6
-
7
-
8
-
9
-
10
-
11
-
12
-
13
-
14
-
15
-
16
-
17
-
18
-
19
-
20
-
21
-
22
-
23
-
24
-
25
-
26
-
27
-
28
-
29
-
30
-
31
-
32
-
33
-
34
-
35
-
36
-
37
-
38
-
39
-
40
-
41
-
42
-
43
-
44
-
45
-
46
-
47
-
48
-
49
-
50
-
51
-
52
-
53
-
54
-
55
-
56
-
57
-
58
-
59
-
 60
60 -
 61
61 -
 62
62 -
 63
63 -
 64
64 -
 65
65 -
 66
66 -
 67
67 -
 68
68 -
 69
69 -
 70
70 -
 71
71 -
 72
72 -
 73
73 -
 74
74 -
 75
75 -
 76
76 -
 77
77 -
 78
78 -
 79
79 -
 80
80 -
81
-
82
-
83
-
84
-
85
-
86
-
87
-
88
-
89
-
90
-
91
-
92
-
93
-
94
-
95
-
96
-
97
-
98
-
99
-
100
-
101
-
102
-
103
-
104
-
105
-
106
-
107
-
108
-
109
-
110
-
111
-
112
-
113
-
114
-
115
-
116
-
117
-
118
-
119
-
120
-
121
-
122
-
123
-
124
-
125
-
126
-
127
-
128
-
129
-
130
-
131
-
132
-
133
-
134
-
135
-
136
-
137
-
138
-
139
-
140
-
141
-
142
-
143
-
144
-
145
-
146
-
147
-
148
-
149
-
150
-
151
-
152
-
153
-
154
-
155
-
156
-
157
-
158
-
159
-
160
-
161
-
162
-
163
-
164
-
165
-
166
-
167
-
168
-
169
-
170
-
171
-
172
-
173
-
174
-
175
-
176
-
177
-
178
-
179
-
180
-
181
-
182
-
183
-
184
-
185
-
186
-
187
-
188
-
189
-
190
-
191
-
192
-
193
-
194
-
195
-
196
-
197
-
198
-
199
-
200
-
201
-
202
-
203
-
204
-
205
-
206
-
207
-
208
-
209
-
210
-
211
-
212
-
213
-
214
-
215
-
216
-
217
-
218
-
219
 |
 |

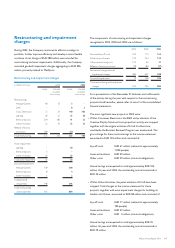
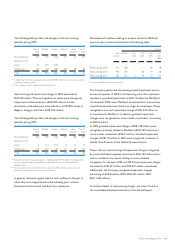
The following table presents the changes in the restructuring
liabilities during 2003:
Dec. 31,
2002
additions utilized released*other
changes**
Dec. 31,
2003
Personnel costs 257 173 (226) (45) (4) 155
Write-down of
assets 15 254 (269) – – –
Other costs 155 63 (86) (38)(8)86
Total 427 490 (581) (83) (12) 241
*In 2003, releases of surplus provisions amounted to EUR 83 million and were mainly caused by
reduced severance payments.
** Other changes primarily related to translation differences.
Restructuring and impairment charges in 2002 amounted to
EUR 503 million. The most significant projects were the capacity
adjustment at Semiconductors (EUR 309 million) and the
termination of development and production of CD/RW drives in
Belgium, Hungary and China (EUR 104 million).
The following table presents the changes in the restructuring
liabilities during 2002:
Dec. 31,
2001
additions utilized released* other
changes**
Dec. 31,
2002
Personnel costs 326 245 (235) (61) (18) 257
Write-down of
assets 6 214 (194) (7) (4) 15
Other costs 110 103 (44) (10)(4) 155
Total 442 562 (473) (78) (26) 427
*Releases of surplus restructuring provisions in 2002 totaled EUR 78 million. The releases were
primarily related to Lighting, Components, Other Activities, Consumer Electronics and
Semiconductors.
** Relates to provisions transferred to the joint venture LG.Philips Displays and restructuring
recorded in conjunction with the acquisition of Marconi.
In general, restructuring plans lead to cash outflows in the year in
which they are recognized and in the following years, and are
financed from the normal cash flow from operations.
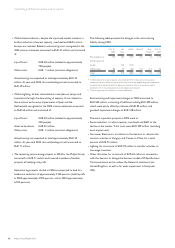
Estimated cash outflows relating to projects started in 2004 and
previous years can be summarized in the following table:
of which
total
charges
non-cash cash
2002
cash
2003
cash
2004
cash
after
2004*
Restructuring 2004 315 168 – – 69 78
Restructuring 2003 490 293 – 82 79 36
Restructuring 2002 562 352 21 85 70 34
*Future cash outflows are based on estimates.
The Company performed the annual goodwill impairment tests in
the second quarter of 2004 for all reporting units; this assessment
resulted in a goodwill impairment of EUR 14 million for MedQuist.
In November 2004, when MedQuist announced that its previously
issued financial statements should no longer be relied upon, Philips
recognized a non-cash impairment charge of EUR 576 million on
its investment in MedQuist. In addition, goodwill impairment
charges were recognized for some smaller investments, amounting
to EUR 6 million.
In 2003, goodwill impairment charges of EUR 148 million were
recognized, primarily related to MedQuist (EUR 139 million) and
some smaller investments (EUR 9 million). Goodwill impairment
charges of EUR 19 million in 2002 were recognized in relation to
Health Care Products of the Medical Systems division.
Philips’ share in restructuring and impairment charges recognized
by unconsolidated companies amounted to EUR 132 million and as
such is included in the results relating to unconsolidated
companies. For the years 2003 and 2002 these impairment charges
amounted to EUR 417 million and EUR 301 million respectively.
Additionally, the Company recognized impairment charges
amounting to EUR 8 million (2003: EUR 431 million; 2002:
EUR 1,305 million).
For further details of restructuring charges, see notes 2 and 5 to
the consolidated financial statements in this Annual Report.
69Philips Annual Report 2004