Philips 2004 Annual Report Download - page 56
Download and view the complete annual report
Please find page 56 of the 2004 Philips annual report below. You can navigate through the pages in the report by either clicking on the pages listed below, or by using the keyword search tool below to find specific information within the annual report.-
 1
1 -
2
-
3
-
4
-
5
-
6
-
7
-
8
-
9
-
10
-
11
-
12
-
13
-
14
-
15
-
16
-
17
-
18
-
19
-
20
-
21
-
22
-
23
-
24
-
25
-
26
-
27
-
28
-
29
-
30
-
31
-
32
-
33
-
34
-
35
-
36
-
37
-
38
-
39
-
40
-
41
-
42
-
43
-
44
-
45
-
 46
46 -
 47
47 -
 48
48 -
 49
49 -
 50
50 -
 51
51 -
 52
52 -
 53
53 -
 54
54 -
 55
55 -
 56
56 -
 57
57 -
 58
58 -
 59
59 -
 60
60 -
 61
61 -
 62
62 -
 63
63 -
 64
64 -
 65
65 -
 66
66 -
67
-
68
-
69
-
70
-
71
-
72
-
73
-
74
-
75
-
76
-
77
-
78
-
79
-
80
-
81
-
82
-
83
-
84
-
85
-
86
-
87
-
88
-
89
-
90
-
91
-
92
-
93
-
94
-
95
-
96
-
97
-
98
-
99
-
100
-
101
-
102
-
103
-
104
-
105
-
106
-
107
-
108
-
109
-
110
-
111
-
112
-
113
-
114
-
115
-
116
-
117
-
118
-
119
-
120
-
121
-
122
-
123
-
124
-
125
-
126
-
127
-
128
-
129
-
130
-
131
-
132
-
133
-
134
-
135
-
136
-
137
-
138
-
139
-
140
-
141
-
142
-
143
-
144
-
145
-
146
-
147
-
148
-
149
-
150
-
151
-
152
-
153
-
154
-
155
-
156
-
157
-
158
-
159
-
160
-
161
-
162
-
163
-
164
-
165
-
166
-
167
-
168
-
169
-
170
-
171
-
172
-
173
-
174
-
175
-
176
-
177
-
178
-
179
-
180
-
181
-
182
-
183
-
184
-
185
-
186
-
187
-
188
-
189
-
190
-
191
-
192
-
193
-
194
-
195
-
196
-
197
-
198
-
199
-
200
-
201
-
202
-
203
-
204
-
205
-
206
-
207
-
208
-
209
-
210
-
211
-
212
-
213
-
214
-
215
-
216
-
217
-
218
-
219
 |
 |

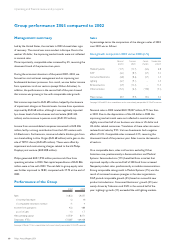
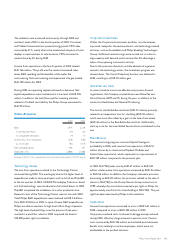
Semiconductors
Key data
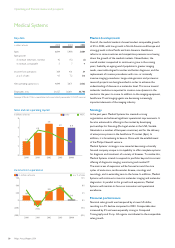
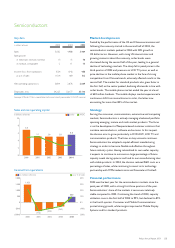
in millions of euros 2002 2003 2004
Sales 5,032 4,988 5,464
Sales growth
% (decrease) increase, nominal (1) (1) 10
% increase, comparable 2 11 13
Income (loss) from operations (524) (342) 450
asa%ofsales (10.4) (6.9) 8.2
Net operating capital (NOC) 3,814 2,676 2,669
Employees (FTEs) 34,225 33,177 35,116
See pages 210 and 211 for a reconciliation to the most directly comparable US GAAP measures.
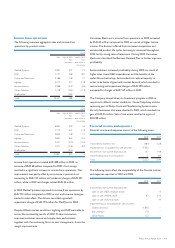
Sales and net operating capital
8
10
6
4
2
0
in billions of euros sales NOC
20042003200220012000
5.0
6.8
5.0
5.1 5.5
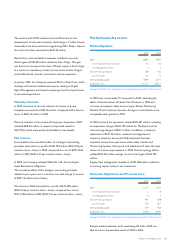
Income from operations
1,453
450
(716) (524) (342)
2,000
1,500
1,000
500
0
(500)
(1,000)
in millions of euros as a % of sales
30%
40%
20%
10%
0%
(10%)
(20%)
20042003200220012000
Market developments
Fueled by the performance of the US and Chinese economies and
following the recovery started in the second half of 2003, the
semiconductor markets peaked in 2004 with 28% growth in
US dollar terms. However, with rising US interest rates and
growing concerns about the recovery, order books were
shortened during the second half of the year, leading to a general
decline of technology markets. The sharp fall in panel prices in the
third quarter of 2004 and pressure on LCD TV prices, as well as
price declines in the mobile phone market in the face of strong
competition from Chinese brands, adversely affected results in the
second half. The market for standard products also grew faster in
the first half, as the sector peaked, declining afterwards in line with
order books. The mobile phone market ended the year at a level
of 650 million handsets. The mobile displays market experienced a
continuous shift from monochrome to color, the latter now
accounting for more than 80% of the market.
Strategy
Serving the consumer, communication, automotive and computing
markets, Semiconductors is actively managing a balanced portfolio
spanning emerging, mature and multi-market products. The focus
is on the development of Nexperia-based customer solutions that
combine semiconductors, software and services. In this respect
the division aims to grow particularly in DVD+RW, LCD TV and
communication products. The focus on key accounts continues.
Semiconductors has adopted a capital-efficient manufacturing
strategy in order to be more flexible and effective throughout
future industry cycles. Having rationalized its own wafer capacity,
it expects to continue to outsource a large percentage of future
capacity needs during upturns and load its own manufacturing sites
with stable products. In 2004, the division reduced R&D costs as a
percentage of sales, while continuing to invest in its technology
partnership with STMicroelectronics and Freescale at Crolles2.
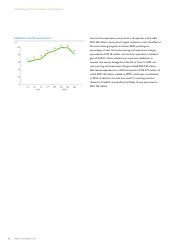
Financial performance
2004 was the best year for the semiconductor markets since the
peak year of 2000, with a strong first three quarters of the year.
Semiconductors’ share of the markets it serves was relatively
stable compared to 2003. Continuing the trend of 2003, capacity
utilization rose in the first half of 2004 to 99%, but declined to 81%
in the fourth quarter. Consumer and Mobile Communications
posted strong growth, while margins improved at Mobile Display
Systems and for standard products.
55Philips Annual Report 2004