Philips 2004 Annual Report Download - page 214
Download and view the complete annual report
Please find page 214 of the 2004 Philips annual report below. You can navigate through the pages in the report by either clicking on the pages listed below, or by using the keyword search tool below to find specific information within the annual report.-
 1
1 -
2
-
3
-
4
-
5
-
6
-
7
-
8
-
9
-
10
-
11
-
12
-
13
-
14
-
15
-
16
-
17
-
18
-
19
-
20
-
21
-
22
-
23
-
24
-
25
-
26
-
27
-
28
-
29
-
30
-
31
-
32
-
33
-
34
-
35
-
36
-
37
-
38
-
39
-
40
-
41
-
42
-
43
-
44
-
45
-
46
-
47
-
48
-
49
-
50
-
51
-
52
-
53
-
54
-
55
-
56
-
57
-
58
-
59
-
60
-
61
-
62
-
63
-
64
-
65
-
66
-
67
-
68
-
69
-
70
-
71
-
72
-
73
-
74
-
75
-
76
-
77
-
78
-
79
-
80
-
81
-
82
-
83
-
84
-
85
-
86
-
87
-
88
-
89
-
90
-
91
-
92
-
93
-
94
-
95
-
96
-
97
-
98
-
99
-
100
-
101
-
102
-
103
-
104
-
105
-
106
-
107
-
108
-
109
-
110
-
111
-
112
-
113
-
114
-
115
-
116
-
117
-
118
-
119
-
120
-
121
-
122
-
123
-
124
-
125
-
126
-
127
-
128
-
129
-
130
-
131
-
132
-
133
-
134
-
135
-
136
-
137
-
138
-
139
-
140
-
141
-
142
-
143
-
144
-
145
-
146
-
147
-
148
-
149
-
150
-
151
-
152
-
153
-
154
-
155
-
156
-
157
-
158
-
159
-
160
-
161
-
162
-
163
-
164
-
165
-
166
-
167
-
168
-
169
-
170
-
171
-
172
-
173
-
174
-
175
-
176
-
177
-
178
-
179
-
180
-
181
-
182
-
183
-
184
-
185
-
186
-
187
-
188
-
189
-
190
-
191
-
192
-
193
-
194
-
195
-
196
-
197
-
198
-
199
-
200
-
201
-
202
-
203
-
 204
204 -
 205
205 -
 206
206 -
 207
207 -
 208
208 -
 209
209 -
 210
210 -
 211
211 -
 212
212 -
 213
213 -
 214
214 -
 215
215 -
 216
216 -
 217
217 -
 218
218 -
 219
219
 |
 |

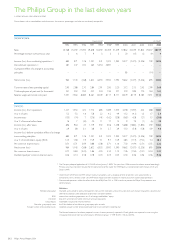
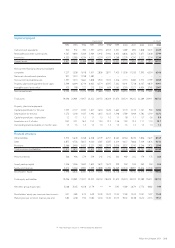
Capital employed
Dutch GAAP US GAAP
1994 1995 1996 1997 1998* 1998* 1999 2000 2001 2002 2003 2004
Cash and cash equivalents 940 932 785 1,397 6,553 6,553 2,331 1,089 890 1,858 3,072 4,349
Receivables and other current assets 4,567 4,890 5,369 5,464 5,442 5,442 6,453 6,806 6,670 5,671 5,638 5,744
Inventories 4,330 5,083 4,334 4,522 4,274 4,017 4,268 5,279 4,290 3,522 3,204 3,230
Current assets 9,837 10,905 10,488 11,383 16,269 16,012 13,052 13,174 11,850 11,051 11,914 13,323
Non-current financial assets/unconsolidated
companies 1,257 1,358 1,618 1,451 2,836 2,871 7,400 11,306 11,033 7,395 6,054 6,546
Net assets discontinued operations 901 1,013 1,198 1,482 ––––––––
Non-current receivables/assets 1,397 1,413 1,662 1,858 1,920 1,920 2,326 2,713 3,080 2,772 2,799 3,050
Property, plant and equipment (book value) 5,599 6,094 6,719 6,935 6,574 6,597 7,332 9,041 7,718 6,137 4,879 4,997
Intangible assets (book value) 105 198 222 213 554 609 1,563 3,290 5,521 4,934 3,765 2,807
Non-current assets 9,259 10,076 11,419 11,939 11,884 11,997 18,621 26,350 27,352 21,238 17,497 17,400
Total assets 19,096 20,981 21,907 23,322 28,153 28,009 31,673 39,524 39,202 32,289 29,411 30,723
Property, plant and equipment:
Capital expenditures for the year 1,535 2,127 2,185 1,627 1,634 1,634 1,662 3,170 2,143 1,161 980 1,286
Depreciation for the year 1,270 1,218 1,437 1,492 1,615 1,615 1,548 1,789 1,969 1,782 1,519 1,373
Capital expenditures : depreciation 1.2 1.7 1.5 1.1 1.0 1.0 1.1 1.8 1.1 0.7 0.6 0.9
Inventories asa%ofsales 18.2 20.1 16.0 15.2 14.0 13.2 13.6 13.9 13.3 11.1 11.0 10.7
Outstanding trade receivables, in months’ sales 1.5 1.5 1.3 1.3 1.3 1.3 1.4 1.5 1.5 1.3 1.4 1.3
Financial structure
Other liabilities 5,373 5,643 5,768 6,328 6,779 6,751 8,262 8,764 8,234 7,836 7,672 8,169
Debt 3,875 4,756 5,855 4,030 3,587 3,587 3,314 4,027 7,866 7,109 5,876 4,513
Provisions 3,566 3,460 3,420 3,251 2,985 2,973 3,056 3,557 3,740 3,246 2,925 2,898
Total provisions and liabilities 12,814 13,859 15,043 13,609 13,351 13,311 14,632 16,348 19,840 18,191 16,473 15,580
Minority interests 336 496 279 559 242 242 333 469 202 179 175 283
Issued, paid-up capital 1,536 1,566 1,600 1,655 1,672 1,672 339 263 263 263 263 263
Surplus and reserves 4,410 5,060 4,985 7,499 12,888 12,784 16,369 22,444 18,897 13,656 12,500 14,597
Stockholders’ equity 5,946 6,626 6,585 9,154 14,560 14,456 16,708 22,707 19,160 13,919 12,763 14,860
Total equity and liabilities 19,096 20,981 21,907 23,322 28,153 28,009 31,673 39,524 39,202 32,289 29,411 30,723
Net debt : group equity ratio 32:68 35:65 42:58 21:79 ** ** 5:95 11:89 26:74 27:73 18:82 1:99
Stockholders’ equity per common share in euros 4.41 4.85 4.74 6.39 10.09 10.02 12.55 17.69 15.04 10.91 9.97 11.60
Market price per common share at year-end 5.83 6.58 7.94 13.80 14.30 14.30 33.75 39.02 33.38 16.70 23.15 19.51
** Not meaningful: net cash in 1998 exceeded the debt level
213Philips Annual Report 2004