Philips 2004 Annual Report Download - page 45
Download and view the complete annual report
Please find page 45 of the 2004 Philips annual report below. You can navigate through the pages in the report by either clicking on the pages listed below, or by using the keyword search tool below to find specific information within the annual report.-
 1
1 -
2
-
3
-
4
-
5
-
6
-
7
-
8
-
9
-
10
-
11
-
12
-
13
-
14
-
15
-
16
-
17
-
18
-
19
-
20
-
21
-
22
-
23
-
24
-
25
-
26
-
27
-
28
-
29
-
30
-
31
-
32
-
33
-
34
-
 35
35 -
 36
36 -
 37
37 -
 38
38 -
 39
39 -
 40
40 -
 41
41 -
 42
42 -
 43
43 -
 44
44 -
 45
45 -
 46
46 -
 47
47 -
 48
48 -
 49
49 -
 50
50 -
 51
51 -
 52
52 -
 53
53 -
 54
54 -
 55
55 -
56
-
57
-
58
-
59
-
60
-
61
-
62
-
63
-
64
-
65
-
66
-
67
-
68
-
69
-
70
-
71
-
72
-
73
-
74
-
75
-
76
-
77
-
78
-
79
-
80
-
81
-
82
-
83
-
84
-
85
-
86
-
87
-
88
-
89
-
90
-
91
-
92
-
93
-
94
-
95
-
96
-
97
-
98
-
99
-
100
-
101
-
102
-
103
-
104
-
105
-
106
-
107
-
108
-
109
-
110
-
111
-
112
-
113
-
114
-
115
-
116
-
117
-
118
-
119
-
120
-
121
-
122
-
123
-
124
-
125
-
126
-
127
-
128
-
129
-
130
-
131
-
132
-
133
-
134
-
135
-
136
-
137
-
138
-
139
-
140
-
141
-
142
-
143
-
144
-
145
-
146
-
147
-
148
-
149
-
150
-
151
-
152
-
153
-
154
-
155
-
156
-
157
-
158
-
159
-
160
-
161
-
162
-
163
-
164
-
165
-
166
-
167
-
168
-
169
-
170
-
171
-
172
-
173
-
174
-
175
-
176
-
177
-
178
-
179
-
180
-
181
-
182
-
183
-
184
-
185
-
186
-
187
-
188
-
189
-
190
-
191
-
192
-
193
-
194
-
195
-
196
-
197
-
198
-
199
-
200
-
201
-
202
-
203
-
204
-
205
-
206
-
207
-
208
-
209
-
210
-
211
-
212
-
213
-
214
-
215
-
216
-
217
-
218
-
219
 |
 |

Group performance 2004 compared to 2003
Management summary
The year 2004
GSales in 2004 amounted to EUR 30,319 million, up 4% compared
with 2003; on a comparable basis sales growth was 9%, mainly
generated by the technology-related sectors
GIncome from operations amounted to EUR 1,607 million in 2004,
compared with EUR 488 million in 2003
GNet income amounted to EUR 2,836 million, and reflected a better
underlying operating performance at Semiconductors and Medical
Systems and improved income from unconsolidated companies
GPositive cash flow from operating activities of EUR 2.7 billion; net
debt of Company virtually nil
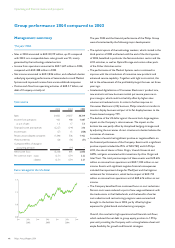
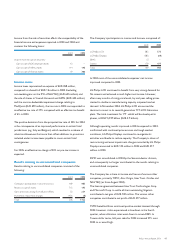
Net income
2002 2003 2004
Sales 31,820 29,037 30,319
Income from operations 420 488 1,607
asa%ofsales 1.3 1.7 5.3
Financial income and expenses (2,227) (244) 216
Income taxes (27) 15 (358)
Results unconsolidated companies (1,346) 506 1,422
Minority interests (26) (56) (51)
Cumulative effect of change in
accounting principle – (14)–
Net income (loss) (3,206) 695 2,836
Per common share - basic (2.51) 0.54 2.22
- diluted (2.51) 0.54 2.21
Euro rate against the US dollar
Jan.
0.8
1.0
1.2
1.4
Jan. July Jan. July Jan. July
2002 2003 2004
The year 2004 and the financial performance of the Philips Group
were characterized by the following major developments:
GThe cyclical upturn of the technology markets, which started in the
third quarter of 2003 and lasted until the end of the third quarter
of 2004, benefited in particular the Semiconductors sector and the
LCD activities, as well as Optical Storage and certain other parts
of the Other Activities sector.
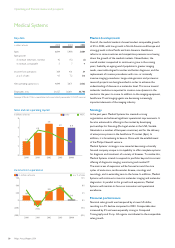
GThe performance of the Medical Systems sector continued to
improve with the introduction of innovative new products and
enhanced service capability. Together with tight cost control, this
led to the achievement of the profitability target that was set three
years ago.
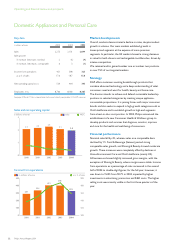
GAccelerated digitalization of Consumer Electronics’ product mix,
new entrants and new business models put severe pressure on
gross margins, which could not be fully offset by higher sales
volumes and reduced costs. In order to further improve its
Consumer Electronics (CE) business, Philips intends to transfer its
monitor display business and part of its flat display business to the
Taiwan-based company TPV.
GThe decline of the US dollar against the euro had a large negative
impact on the Company’s sales revenues. The impact on the
bottom line was partly offset by disciplined hedging strategies and
by adjusting the currencies of cost structures to better balance the
currencies of revenues.
GA number of events had significant positive or negative effects on
the financial performance of the Company. Events with a significant
positive impact included the IPOs of NAVTEQ and LG.Philips
LCD, the sale of shares of Atos Origin, Vivendi Universal and
ASML, and gains associated with transactions by Atos Origin and
InterTrust. The total positive impact of these events was EUR 635
million on income from operations and EUR 1,590 million on net
income. Events with significant negative financial consequences
included the impairment charge for MedQuist and the litigation
settlement for Volumetrics, which had an impact of EUR 723
million on income from operations and of EUR 676 million on net
income.
GThe Company benefited from continued focus on cost reductions.
Pension costs were reduced as part of new wage settlements with
the trade unions in the Netherlands, and the benefits of earlier
cost-reduction and restructuring programs were secured and
brought to the bottom line in 2004, partly offset by higher
expenses for global brand and advertising campaigns.
Overall, this resulted in high operational and financial cash flows,
which reduced the net debt to group equity position to 1:99 by
year-end, providing the Company with a strong balance sheet and
ample flexibility for growth and financial strategies.
44 Philips Annual Report 2004
Operating and financial review and prospects