Philips 2004 Annual Report Download - page 213
Download and view the complete annual report
Please find page 213 of the 2004 Philips annual report below. You can navigate through the pages in the report by either clicking on the pages listed below, or by using the keyword search tool below to find specific information within the annual report.-
 1
1 -
2
-
3
-
4
-
5
-
6
-
7
-
8
-
9
-
10
-
11
-
12
-
13
-
14
-
15
-
16
-
17
-
18
-
19
-
20
-
21
-
22
-
23
-
24
-
25
-
26
-
27
-
28
-
29
-
30
-
31
-
32
-
33
-
34
-
35
-
36
-
37
-
38
-
39
-
40
-
41
-
42
-
43
-
44
-
45
-
46
-
47
-
48
-
49
-
50
-
51
-
52
-
53
-
54
-
55
-
56
-
57
-
58
-
59
-
60
-
61
-
62
-
63
-
64
-
65
-
66
-
67
-
68
-
69
-
70
-
71
-
72
-
73
-
74
-
75
-
76
-
77
-
78
-
79
-
80
-
81
-
82
-
83
-
84
-
85
-
86
-
87
-
88
-
89
-
90
-
91
-
92
-
93
-
94
-
95
-
96
-
97
-
98
-
99
-
100
-
101
-
102
-
103
-
104
-
105
-
106
-
107
-
108
-
109
-
110
-
111
-
112
-
113
-
114
-
115
-
116
-
117
-
118
-
119
-
120
-
121
-
122
-
123
-
124
-
125
-
126
-
127
-
128
-
129
-
130
-
131
-
132
-
133
-
134
-
135
-
136
-
137
-
138
-
139
-
140
-
141
-
142
-
143
-
144
-
145
-
146
-
147
-
148
-
149
-
150
-
151
-
152
-
153
-
154
-
155
-
156
-
157
-
158
-
159
-
160
-
161
-
162
-
163
-
164
-
165
-
166
-
167
-
168
-
169
-
170
-
171
-
172
-
173
-
174
-
175
-
176
-
177
-
178
-
179
-
180
-
181
-
182
-
183
-
184
-
185
-
186
-
187
-
188
-
189
-
190
-
191
-
192
-
193
-
194
-
195
-
196
-
197
-
198
-
199
-
200
-
201
-
202
-
 203
203 -
 204
204 -
 205
205 -
 206
206 -
 207
207 -
 208
208 -
 209
209 -
 210
210 -
 211
211 -
 212
212 -
 213
213 -
 214
214 -
 215
215 -
 216
216 -
 217
217 -
 218
218 -
 219
219
 |
 |

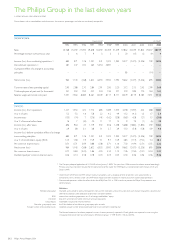
General data
Dutch GAAP US GAAP
1994 1995 1996 1997 1998* 1998* 1999 2000 2001 2002 2003 2004
Sales 23,768 25,259 27,094 29,658 30,459 30,459 31,459 37,862 32,339 31,820 29,037 30,319
Percentage increase over previous year 267933320(15) (2) (9) 4
Income (loss) from continuing operations 1) 683 971 126 1,231 541 1,025 1,595 9,577 (2,475) (3,206) 709 2,836
Discontinued operations 2) 281 247 202 263 5,054 4,891 – – – – – –
Cumulative effect of a change in accounting
principles –––––––85––(14) –
Net income (loss) 964 1,143 (268) 2,602 6,053 5,900 1,590 9,662 (2,475) (3,206) 695 2,836
Turnover rate of net operating capital 2.95 2.88 2.70 2.84 2.91 2.95 3.20 3.12 2.15 2.43 2.99 3.60
Total employees at year-end (in thousands) 241 253 250 252 234 234 227 219 189 170 164 162
Salaries, wages and social costs paid 7,031 7,363 8,083 8,261 8,209 8,117 8,111 8,479 8,119 8,183 7,451 7,115
Income
Income (loss) from operations 1,227 1,350 422 1,714 685 1,289 1,553 4,258 (1,395) 420 488 1,607
Asa%ofsales 5.2 5.3 1.6 5.8 2.2 4.2 4.9 11.2 (4.3) 1.3 1.7 5.3
Income taxes (135) (74) 7 (276) (41) (162) (208) (563) 428 (27) 15 (358)
Asa%ofincome before taxes 16 7 (40) 20 11 17 14 9 19 (1) (6) 20
Income (loss) after taxes 696 964 25 1,119 332 816 1,238 5,688 (1,882) (1,834) 259 1,465
Asa%ofsales 2.9 3.8 0.1 3.8 1.1 2.7 3.9 15.0 (5.8) (5.8) 0.9 4.8
Income (loss) before cumulative effect of a change
in accounting principles 683 971 126 1,231 541 1,025 1,595 9,577 (2,475) (3,206) 709 2,836
Asa%ofstockholders’ equity (ROE) 12.5 15.8 1.9 15.9 5.1 9.7 10.9 48.5 (11.9) (19.2) 5.4 20.3
Per common share in euros 0.51 0.71 0.09 0.88 0.38 0.71 1.16 7.30 (1.94) (2.51) 0.55 2.22
Net income (loss) 964 1,143 (268) 2,602 6,053 5,900 1,590 9,662 (2,475) (3,206) 695 2,836
Per common share in euros 0.72 0.84 (0.20) 1.86 4.20 4.10 1.15 7.36 (1.94) (2.51) 0.54 2.22
Dividend paid per common share in euros 0.06 0.14 0.18 0.18 0.23 0.23 0.25 0.30 0.36 0.36 0.36 0.36
*The Company adopted application of US GAAP as from January 1, 2002. The years from 1998 onwards have been restated accordingly.
Previous years have not been restated. For the convenience of the reader the 1998 figures are presented on both the basis of US and
Dutch GAAP.
1) Under Dutch GAAP, prior to 1999, certain material transactions, such as disposals of lines of activities, were accounted for as
extraordinary items, whereas under US GAAP these would have been recorded in income (loss) from (continuing) operations.
2) Discontinued operations reflect the effect of the sale of PolyGram N.V. in 1998 in order to present the Philips Group accounts on a
continuing basis.
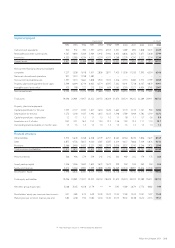
Definitions
Net operating capital: intangible assets, property, plant and equipment, non-current receivables and current assets excl. cash and cash equivalents, securities and
deferred tax positions, after deduction of provisions and other liabilities
ROE: income from continuing operations as a % of average stockholders’ equity
Net debt: long-term and short-term debt net of cash and cash equivalents
Group equity: stockholders’ equity and minority interests
Net debt : group equity ratio: the % distribution of net debt over group equity plus net debt
Average number of outstanding shares: weighted average number of outstanding common shares during the reporting year
The financial statements have been prepared in euros. Amounts previously reported in Dutch guilders are reported in euros using the
irrevocably fixed conversion rate which became effective on January 1, 1999 (EUR 1 = NLG 2.20371).
212 Philips Annual Report 2004
The Philips Group in the last eleven years
in millions of euros unless otherwise stated
Due to factors such as consolidations and divestments, the amounts, percentages and ratios are not directly comparable.