APC 2013 Annual Report Download - page 10
Download and view the complete annual report
Please find page 10 of the 2013 APC annual report below. You can navigate through the pages in the report by either clicking on the pages listed below, or by using the keyword search tool below to find specific information within the annual report.-
 1
1 -
 2
2 -
 3
3 -
 4
4 -
 5
5 -
 6
6 -
 7
7 -
 8
8 -
 9
9 -
 10
10 -
 11
11 -
 12
12 -
 13
13 -
 14
14 -
 15
15 -
 16
16 -
 17
17 -
 18
18 -
 19
19 -
 20
20 -
 21
21 -
22
-
23
-
24
-
25
-
26
-
27
-
28
-
29
-
30
-
31
-
32
-
33
-
34
-
35
-
36
-
37
-
38
-
39
-
40
-
41
-
42
-
43
-
44
-
45
-
46
-
47
-
48
-
49
-
50
-
51
-
52
-
53
-
54
-
55
-
56
-
57
-
58
-
59
-
60
-
61
-
62
-
63
-
64
-
65
-
66
-
67
-
68
-
69
-
70
-
71
-
72
-
73
-
74
-
75
-
76
-
77
-
78
-
79
-
80
-
81
-
82
-
83
-
84
-
85
-
86
-
87
-
88
-
89
-
90
-
91
-
92
-
93
-
94
-
95
-
96
-
97
-
98
-
99
-
100
-
101
-
102
-
103
-
104
-
105
-
106
-
107
-
108
-
109
-
110
-
111
-
112
-
113
-
114
-
115
-
116
-
117
-
118
-
119
-
120
-
121
-
122
-
123
-
124
-
125
-
126
-
127
-
128
-
129
-
130
-
131
-
132
-
133
-
134
-
135
-
136
-
137
-
138
-
139
-
140
-
141
-
142
-
143
-
144
-
145
-
146
-
147
-
148
-
149
-
150
-
151
-
152
-
153
-
154
-
155
-
156
-
157
-
158
-
159
-
160
-
161
-
162
-
163
-
164
-
165
-
166
-
167
-
168
-
169
-
170
-
171
-
172
-
173
-
174
-
175
-
176
-
177
-
178
-
179
-
180
-
181
-
182
-
183
-
184
-
185
-
186
-
187
-
188
-
189
-
190
-
191
-
192
-
193
-
194
-
195
-
196
-
197
-
198
-
199
-
200
-
201
-
202
-
203
-
204
-
205
-
206
-
207
-
208
-
209
-
210
-
211
-
212
-
213
-
214
-
215
-
216
-
217
-
218
-
219
-
220
-
221
-
222
-
223
-
224
-
225
-
226
-
227
-
228
-
229
-
230
-
231
-
232
-
233
-
234
-
235
-
236
-
237
-
238
-
239
-
240
-
241
-
242
-
243
-
244
-
245
-
246
-
247
-
248
-
249
-
250
-
251
-
252
-
253
-
254
-
255
-
256
-
257
-
258
-
259
-
260
-
261
-
262
-
263
-
264
-
265
-
266
-
267
-
268
-
269
-
270
-
271
-
272
-
273
-
274
-
275
-
276
-
277
-
278
-
279
-
280
-
281
-
282
-
283
-
284
-
285
-
286
-
287
-
288
-
289
-
290
-
291
-
292
-
293
-
294
-
295
-
296
-
297
-
298
-
299
-
300
-
301
-
302
-
303
-
304
-
305
-
306
-
307
-
308
-
309
-
310
-
311
-
312
-
313
-
314
-
315
-
316
-
317
-
318
-
319
-
320
-
321
-
322
-
323
-
324
-
325
-
326
-
327
-
328
-
329
-
330
-
331
-
332
 |
 |

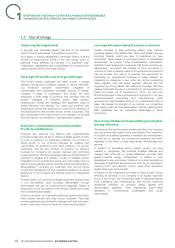
KEY FIGURES 2013
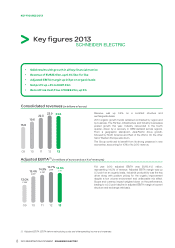
Key figures 2013
SCHNEIDER ELECTRIC
Solid results with growth in all key financial metrics
•
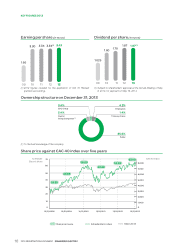
Revenue of EUR23.6 bn, up 0.4% like-for like
•
Adjusted EBITA margin up 0.3 pt on organic basis
•
Net profit up +4% to EUR1.9 bn
•
Record Free Cash Flow of EUR2.2 bn, up 5%
•
Consolidated revenues (in billions of euros)
11
22.3
09
15.8
10
19.6
12
23.9
13
23.6
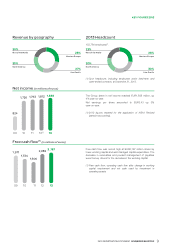
Revenue was up 0.4% on a constant structure and
exchangerate basis.
2013 organic growth trends remained contrasted by region and
by business. The Partner, Infrastructure and Industry businesses
posted growth this year. Industry rebounded in the fourth
quarter, driven by a recovery in OEM demand across regions.
From a geographic standpoint, Asia-Pacific drove growth,
followed by North America and Rest of the World. On the other
hand, Western Europe was down.
The Group continued to benefit from its strong presence in new
economies, accounting for 43% of its 2013 revenue.
Adjusted EBITA(1) (in millions of euros and as a % of revenues)
1109 10
13.0%
2 ,048
15.4%
3,019
14.3%
3 ,190
12
14.7%
3,515
13
14.5%
3,412
Full year 2013 adjusted EBITA was EUR3,412 million,
representing 14.5% of revenue. Adjusted EBITA margin was up
0.3 point on an organic basis. Industrial productivity was the key
driver along with positive pricing for the organic improvement
despite a low volume environment and unfavorable mix effect.
Scope and currency impact weighed down on the performance,
leading to a 0.2 point decline in adjusted EBITA margin at current
structure and exchange rate basis.
Adjusted EBITA: EBITA before restructuring costs and otheroperating income and expenses.(1)
82013 REGISTRATION DOCUMENT SCHNEIDER ELECTRIC