APC 2013 Annual Report Download - page 121
Download and view the complete annual report
Please find page 121 of the 2013 APC annual report below. You can navigate through the pages in the report by either clicking on the pages listed below, or by using the keyword search tool below to find specific information within the annual report.-
 1
1 -
2
-
3
-
4
-
5
-
6
-
7
-
8
-
9
-
10
-
11
-
12
-
13
-
14
-
15
-
16
-
17
-
18
-
19
-
20
-
21
-
22
-
23
-
24
-
25
-
26
-
27
-
28
-
29
-
30
-
31
-
32
-
33
-
34
-
35
-
36
-
37
-
38
-
39
-
40
-
41
-
42
-
43
-
44
-
45
-
46
-
47
-
48
-
49
-
50
-
51
-
52
-
53
-
54
-
55
-
56
-
57
-
58
-
59
-
60
-
61
-
62
-
63
-
64
-
65
-
66
-
67
-
68
-
69
-
70
-
71
-
72
-
73
-
74
-
75
-
76
-
77
-
78
-
79
-
80
-
81
-
82
-
83
-
84
-
85
-
86
-
87
-
88
-
89
-
90
-
91
-
92
-
93
-
94
-
95
-
96
-
97
-
98
-
99
-
100
-
101
-
102
-
103
-
104
-
105
-
106
-
107
-
108
-
109
-
110
-
 111
111 -
 112
112 -
 113
113 -
 114
114 -
 115
115 -
 116
116 -
 117
117 -
 118
118 -
 119
119 -
 120
120 -
 121
121 -
 122
122 -
 123
123 -
 124
124 -
 125
125 -
 126
126 -
 127
127 -
 128
128 -
 129
129 -
 130
130 -
 131
131 -
132
-
133
-
134
-
135
-
136
-
137
-
138
-
139
-
140
-
141
-
142
-
143
-
144
-
145
-
146
-
147
-
148
-
149
-
150
-
151
-
152
-
153
-
154
-
155
-
156
-
157
-
158
-
159
-
160
-
161
-
162
-
163
-
164
-
165
-
166
-
167
-
168
-
169
-
170
-
171
-
172
-
173
-
174
-
175
-
176
-
177
-
178
-
179
-
180
-
181
-
182
-
183
-
184
-
185
-
186
-
187
-
188
-
189
-
190
-
191
-
192
-
193
-
194
-
195
-
196
-
197
-
198
-
199
-
200
-
201
-
202
-
203
-
204
-
205
-
206
-
207
-
208
-
209
-
210
-
211
-
212
-
213
-
214
-
215
-
216
-
217
-
218
-
219
-
220
-
221
-
222
-
223
-
224
-
225
-
226
-
227
-
228
-
229
-
230
-
231
-
232
-
233
-
234
-
235
-
236
-
237
-
238
-
239
-
240
-
241
-
242
-
243
-
244
-
245
-
246
-
247
-
248
-
249
-
250
-
251
-
252
-
253
-
254
-
255
-
256
-
257
-
258
-
259
-
260
-
261
-
262
-
263
-
264
-
265
-
266
-
267
-
268
-
269
-
270
-
271
-
272
-
273
-
274
-
275
-
276
-
277
-
278
-
279
-
280
-
281
-
282
-
283
-
284
-
285
-
286
-
287
-
288
-
289
-
290
-
291
-
292
-
293
-
294
-
295
-
296
-
297
-
298
-
299
-
300
-
301
-
302
-
303
-
304
-
305
-
306
-
307
-
308
-
309
-
310
-
311
-
312
-
313
-
314
-
315
-
316
-
317
-
318
-
319
-
320
-
321
-
322
-
323
-
324
-
325
-
326
-
327
-
328
-
329
-
330
-
331
-
332
 |
 |

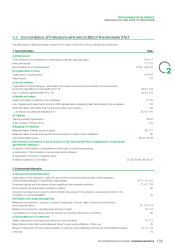
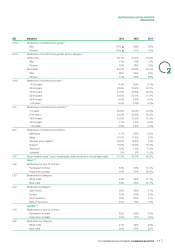
SUSTAINABLE DEVELOPMENT
INDICATORS
Health and safety of employees
GRI Indicators 2013 2012 2011
LA7 Number of medical incidents (1) 733 ▲878 1,156
of which Schneider Electric employees 640 746 918
of which subcontractors 93 132 238
LA7 Number of lost-time accidents(1) 366 ▲364 531
of which Schneider Electric employees 317 312 434
of which subcontractors 49 52 96 2
LA7 Number of fatal accidents 3 1 0
of which Schneider Electric employees 3 1 0
of which subcontractors 0 0 0
LA7 Lost-Time Injury Rate (LTIR)(7) 1.18 ▲1.42 2.06
of which Schneider Electric employees 1.31 1.41
of which subcontractors 0.73 1.54
LA7 Lost-Time Day Rate (LTDR)(7) 38.67 ▲47.98 56.00
of which Schneider Electric employees 45.04 51.60
of which subcontractors 15.81 24.15
LA7 Number of lost days 11,961 ▲12,263 14,284
of which Schneider Electric employees 10,896 11,449 12,815
of which subcontractors 1,065 814 1,491
LA7 Number of hours worked 309,279,615▲255,566,952 257,533,623
of which Schneider Electric employees 241,930,530 221,866,584 222,372,065
of which subcontractors 67,349,085 33,700,368 35,161,558
LA7 Medical Incident Rate(7) 2.37▲3.44 4.49
of which Schneider Electric employees 2.65 3.36 4.13
of which subcontractors 1.38 3.92 6,77
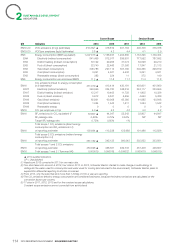
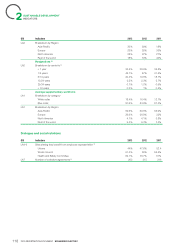
Talent development and training
GRI Indicators 2013 2012 2011
LA10 Number of training hours(2) 2,416,766 ▲2,489,421 2,205,713
LA10 Average hours of training per person(2) 20.3 21.5 21.1
White collar 24.4 27.7 27.2
Blue collar* 15.3 15.4 15
LA10 Breakdown of hours by category(2)
White collar 60.3% 64.2% 64.3%
Blue collar* 39.7% 35.8% 35.7%
LA10 Breakdown of hours by training type(2)
Health, safety and environment 18.4% 14.6% 14.3%
Technical 25.2% 29.2% 36.8%
Languages 9.5% 16.2% UA
IT 2.4% 4.8% UA
Solutions 5.8% 5.1% UA
Management and Leadership 14.6% 15.1% 12.4%
Others 19.8% 15% 20%
119
2013 REGISTRATION DOCUMENT SCHNEIDER ELECTRIC