APC 2013 Annual Report Download - page 203
Download and view the complete annual report
Please find page 203 of the 2013 APC annual report below. You can navigate through the pages in the report by either clicking on the pages listed below, or by using the keyword search tool below to find specific information within the annual report.-
 1
1 -
2
-
3
-
4
-
5
-
6
-
7
-
8
-
9
-
10
-
11
-
12
-
13
-
14
-
15
-
16
-
17
-
18
-
19
-
20
-
21
-
22
-
23
-
24
-
25
-
26
-
27
-
28
-
29
-
30
-
31
-
32
-
33
-
34
-
35
-
36
-
37
-
38
-
39
-
40
-
41
-
42
-
43
-
44
-
45
-
46
-
47
-
48
-
49
-
50
-
51
-
52
-
53
-
54
-
55
-
56
-
57
-
58
-
59
-
60
-
61
-
62
-
63
-
64
-
65
-
66
-
67
-
68
-
69
-
70
-
71
-
72
-
73
-
74
-
75
-
76
-
77
-
78
-
79
-
80
-
81
-
82
-
83
-
84
-
85
-
86
-
87
-
88
-
89
-
90
-
91
-
92
-
93
-
94
-
95
-
96
-
97
-
98
-
99
-
100
-
101
-
102
-
103
-
104
-
105
-
106
-
107
-
108
-
109
-
110
-
111
-
112
-
113
-
114
-
115
-
116
-
117
-
118
-
119
-
120
-
121
-
122
-
123
-
124
-
125
-
126
-
127
-
128
-
129
-
130
-
131
-
132
-
133
-
134
-
135
-
136
-
137
-
138
-
139
-
140
-
141
-
142
-
143
-
144
-
145
-
146
-
147
-
148
-
149
-
150
-
151
-
152
-
153
-
154
-
155
-
156
-
157
-
158
-
159
-
160
-
161
-
162
-
163
-
164
-
165
-
166
-
167
-
168
-
169
-
170
-
171
-
172
-
173
-
174
-
175
-
176
-
177
-
178
-
179
-
180
-
181
-
182
-
183
-
184
-
185
-
186
-
187
-
188
-
189
-
190
-
191
-
192
-
 193
193 -
 194
194 -
 195
195 -
 196
196 -
 197
197 -
 198
198 -
 199
199 -
 200
200 -
 201
201 -
 202
202 -
 203
203 -
 204
204 -
 205
205 -
 206
206 -
 207
207 -
 208
208 -
 209
209 -
 210
210 -
 211
211 -
 212
212 -
 213
213 -
214
-
215
-
216
-
217
-
218
-
219
-
220
-
221
-
222
-
223
-
224
-
225
-
226
-
227
-
228
-
229
-
230
-
231
-
232
-
233
-
234
-
235
-
236
-
237
-
238
-
239
-
240
-
241
-
242
-
243
-
244
-
245
-
246
-
247
-
248
-
249
-
250
-
251
-
252
-
253
-
254
-
255
-
256
-
257
-
258
-
259
-
260
-
261
-
262
-
263
-
264
-
265
-
266
-
267
-
268
-
269
-
270
-
271
-
272
-
273
-
274
-
275
-
276
-
277
-
278
-
279
-
280
-
281
-
282
-
283
-
284
-
285
-
286
-
287
-
288
-
289
-
290
-
291
-
292
-
293
-
294
-
295
-
296
-
297
-
298
-
299
-
300
-
301
-
302
-
303
-
304
-
305
-
306
-
307
-
308
-
309
-
310
-
311
-
312
-
313
-
314
-
315
-
316
-
317
-
318
-
319
-
320
-
321
-
322
-
323
-
324
-
325
-
326
-
327
-
328
-
329
-
330
-
331
-
332
 |
 |

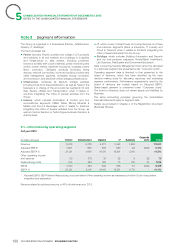
CONSOLIDATED FINANCIALSTATEMENTS ATDECEMBER 31, 2013
NOTES TO THE CONSOLIDATED FINANCIAL STATEMENTS
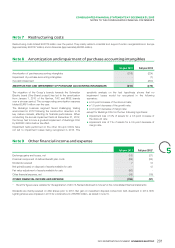
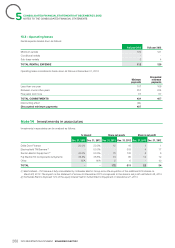
Restructuring costs
Note7
Restructuring costs totaled EUR176million over the period. They mainly relate to industrial and support function reorganizations in Europe
(approximately EUR127million) and in Americas (approximately EUR25million).
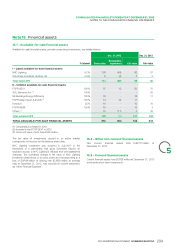
Amortization and impairment of purchase accounting intangibles
Note8
Full year 2013 Full year 2012
Amortization of purchase accounting intangibles (218) (224)
Impairment of purchase accounting intangibles - (1)
Goodwill impairment - (250)
AMORTIZATION AND IMPAIRMENT OF PURCHASE ACCOUNTING INTANGIBLES (218) (475)
The migration of the Group’s brands towards the Schneider sensitivity analysis on the test hypothesis shows that no
Electric brand (One Brand project) has led to the amortization impairment losses would be recognized in the following
from January1, 2010 of the Xantrex, TAC and MGE brands scenarios:
over a six-year period. The corresponding amortization expense a 0.5point increase of the discount rate;
l
totaled EUR61million over the year. a 1.0point decrease of the growth rate;
l
The Buildings business segment faced challenging trading a 0.5point decrease of margin rate;
l
environment in 2012 following the construction downturn in its except for Buildings CGU on the two following hypothesis:
key mature markets, affecting its financial performance. When impairment loss of 4% of assets for a 0.5point increase of
l
conducting the annual impairment tests at December31, 2012, the discount rate;
the Group had to book a goodwill impairment of Buildings CGU impairment loss of 1% of assets for a 0.5point decrease of
l
by EUR250million before tax effect. margin rate.
Impairment tests performed on the other Group’s CGUs have
not led to impairment losses being recognized in 2013. The
Other financial income and expense
Note9
5
Full year 2013 Full year 2012*
Exchange gains and losses, net (12) (21)
Financial component of defined benefit plan costs (69) (84)
Dividends received 712
Net gains/(losses) on disposal of assets available for sale -12
Fair value adjustment of assets available for sale (50) -
Other financial expense, net (35) (16)
OTHER FINANCIAL INCOME AND EXPENSE (159) (97)
The 2012 figures were restated for the application of IAS19 Revised disclosed in note22 of the consolidated financial statements.*
Dividends are mainly received on AXA shares prior to 2013. Net gain on investment disposal comes from AXA divestment in 2012. NVC
Lighting shares were impaired in 2013 for a total amount of EUR50million, as stated in note15.
201
2013 REGISTRATION DOCUMENT SCHNEIDER ELECTRIC