APC 2013 Annual Report Download - page 177
Download and view the complete annual report
Please find page 177 of the 2013 APC annual report below. You can navigate through the pages in the report by either clicking on the pages listed below, or by using the keyword search tool below to find specific information within the annual report.-
 1
1 -
2
-
3
-
4
-
5
-
6
-
7
-
8
-
9
-
10
-
11
-
12
-
13
-
14
-
15
-
16
-
17
-
18
-
19
-
20
-
21
-
22
-
23
-
24
-
25
-
26
-
27
-
28
-
29
-
30
-
31
-
32
-
33
-
34
-
35
-
36
-
37
-
38
-
39
-
40
-
41
-
42
-
43
-
44
-
45
-
46
-
47
-
48
-
49
-
50
-
51
-
52
-
53
-
54
-
55
-
56
-
57
-
58
-
59
-
60
-
61
-
62
-
63
-
64
-
65
-
66
-
67
-
68
-
69
-
70
-
71
-
72
-
73
-
74
-
75
-
76
-
77
-
78
-
79
-
80
-
81
-
82
-
83
-
84
-
85
-
86
-
87
-
88
-
89
-
90
-
91
-
92
-
93
-
94
-
95
-
96
-
97
-
98
-
99
-
100
-
101
-
102
-
103
-
104
-
105
-
106
-
107
-
108
-
109
-
110
-
111
-
112
-
113
-
114
-
115
-
116
-
117
-
118
-
119
-
120
-
121
-
122
-
123
-
124
-
125
-
126
-
127
-
128
-
129
-
130
-
131
-
132
-
133
-
134
-
135
-
136
-
137
-
138
-
139
-
140
-
141
-
142
-
143
-
144
-
145
-
146
-
147
-
148
-
149
-
150
-
151
-
152
-
153
-
154
-
155
-
156
-
157
-
158
-
159
-
160
-
161
-
162
-
163
-
164
-
165
-
166
-
 167
167 -
 168
168 -
 169
169 -
 170
170 -
 171
171 -
 172
172 -
 173
173 -
 174
174 -
 175
175 -
 176
176 -
 177
177 -
 178
178 -
 179
179 -
 180
180 -
 181
181 -
 182
182 -
 183
183 -
 184
184 -
 185
185 -
 186
186 -
 187
187 -
188
-
189
-
190
-
191
-
192
-
193
-
194
-
195
-
196
-
197
-
198
-
199
-
200
-
201
-
202
-
203
-
204
-
205
-
206
-
207
-
208
-
209
-
210
-
211
-
212
-
213
-
214
-
215
-
216
-
217
-
218
-
219
-
220
-
221
-
222
-
223
-
224
-
225
-
226
-
227
-
228
-
229
-
230
-
231
-
232
-
233
-
234
-
235
-
236
-
237
-
238
-
239
-
240
-
241
-
242
-
243
-
244
-
245
-
246
-
247
-
248
-
249
-
250
-
251
-
252
-
253
-
254
-
255
-
256
-
257
-
258
-
259
-
260
-
261
-
262
-
263
-
264
-
265
-
266
-
267
-
268
-
269
-
270
-
271
-
272
-
273
-
274
-
275
-
276
-
277
-
278
-
279
-
280
-
281
-
282
-
283
-
284
-
285
-
286
-
287
-
288
-
289
-
290
-
291
-
292
-
293
-
294
-
295
-
296
-
297
-
298
-
299
-
300
-
301
-
302
-
303
-
304
-
305
-
306
-
307
-
308
-
309
-
310
-
311
-
312
-
313
-
314
-
315
-
316
-
317
-
318
-
319
-
320
-
321
-
322
-
323
-
324
-
325
-
326
-
327
-
328
-
329
-
330
-
331
-
332
 |
 |

BUSINESS REVIEW
REVIEW OF THE CONSOLIDATED FINANCIAL STATEMENTS
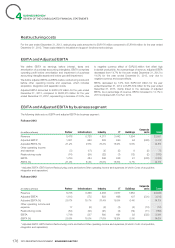
The Industry business generated revenues of EUR4,311million, supported by the success of Luminous and sustained demand for
or 18% of the consolidated total. This represents a decrease of critical power in some new economies. The Solution business
-3.8% on a reported basis and an increase of +1.3% on a declined, as North America experienced slow project activity for
like-for-like basis. The product business was up slightly, reflecting small to mid-sized data centers and demand in Western Europe
good demand from OEMs (machine manufacturers) across all was soft.
regions after a soft start in mature countries in the first half. The The Buildings business generated revenues of EUR1,594million,
solution business posted good growth, driven by the success of or 7% of the consolidated total. This represents a decrease of
SoMachine OEM solutions and installed base services. -5.2% on a reported basis, while organic growth was flat at -0.2%.
The IT business generated revenues of EUR3,442million, or 15% Products declined due to the continuing challenging external
of the consolidated total. This represents a decrease of -6.4% on a environment. Solutions business was up driven by services growth
reported basis and -1.4% like-for-like basis, with mixed trends that offset the decline of building management systems, impacted
between Products and Solutions. The Product business grew, by low public investments in mature countries.
Gross profit
Gross profit decreased from EUR9,057million for the year ended revenues, gross profit remained stable at 37.8% in2012 and 2013
December31, 2012 to EUR8,891million for the year ended thanks to the industrial productivity that was the key driver along
December31, 2013, or -1.8%, the performance being weighed with positive pricing for the organic improvement despite a low
down by negative scope and currency effect. As a percentage of volume environment and unfavorable mix effect.
Support Function Costs: Research and development and selling,
generalandadministrative expenses
Research and development expenses, excluding capitalized Selling, general and administrative expenses decreased by 1.8%
4
development costs and development costs reported as cost of from EUR5,035million for the year ended December31, 2012 to
sales, increased by 5.5% from EUR507million for the year ended EUR4,944million for the year ended December31, 2013. As a
December31, 2012 to EUR535million for the year ended percentage of revenues, selling, general and administrative
December31, 2013. As a percentage of revenues, the net cost of expenses remained stable at 21.0% for both 2013 and 2012, as
research and development increased to 2.3% of revenues for the operational efficiency had compensated most of investments.
year ended December31, 2013 (2.1% for the year ended Combined, total support function costs, that is, research and
December31, 2012). development expenses together with selling, general and
Total research and development expenses, including capitalized
administrative costs, totaled EUR5,479million for the year ended
development costs and development costs reported as cost of sales
December31, 2013 compared to EUR5,542million for the year
(see note4 to the Audited Consolidated Financial Statements) increased
ended December31, 2012, a decrease of 1.1%. Consequently to
by 8.2% from EUR1,058million for the year ended December31, 2012
the investments in research and development expenses and
to EUR1,145million for the year ended December31, 2013. As a
commercial initiatives for new economies and services, in line with
percentage of revenues, total research and development expenses
the strategic plan, our support functions costs to sales ratio
increased to 4.9% for the year ended December31, 2013 from 4.4%
increased from 23.1% for the year ended December31, 2012 to
for the year ended December31, 2012.
23.3% for the year ended December31, 2013.
In2013, the net effect of capitalized development costs and
amortization of capitalized development costs amounts to
EUR179million on operating income (EUR153million in2012).
Other operating income and expenses
For the year ended December31, 2013, other operating income For the year ended December31, 2012, other operating income
and expenses amounted to a net income of EUR73million, and expenses amounted to a net expense of EUR10million,
including costs linked to acquisitions for EUR52million, a including costs linked to acquisitions for EUR52million, a
EUR173million gain on the curtailment of employee benefit plans EUR21million gain on the curtailment of a U.S. employee benefit
in the U.S., in France and in Norway and miscellaneous other plan and miscellaneous other operating incomes and expenses
operating incomes and expenses amounting to a net expense of amounting to a net of EUR21million. Costs linked to acquisitions
EUR48million. Costs linked to acquisitions are acquisition, are acquisition, integration and separation costs on 2011 and 2012
integration and separation costs on 2013 acquisitions, notably acquisitions, notably Telvent and M&C Energy Group. Net other
Electroshield – TM Samara and acquisition costs linked to Invensys operating income includes mainly reversal of provisions for litigation
(see note30, Post-closing events). Net other operating expense or claims that expired on December31, 2012.
includes mainly provisions for litigation or claims and gain on
disposal of fixed assets.
175
2013 REGISTRATION DOCUMENT SCHNEIDER ELECTRIC