APC 2013 Annual Report Download - page 75
Download and view the complete annual report
Please find page 75 of the 2013 APC annual report below. You can navigate through the pages in the report by either clicking on the pages listed below, or by using the keyword search tool below to find specific information within the annual report.-
 1
1 -
2
-
3
-
4
-
5
-
6
-
7
-
8
-
9
-
10
-
11
-
12
-
13
-
14
-
15
-
16
-
17
-
18
-
19
-
20
-
21
-
22
-
23
-
24
-
25
-
26
-
27
-
28
-
29
-
30
-
31
-
32
-
33
-
34
-
35
-
36
-
37
-
38
-
39
-
40
-
41
-
42
-
43
-
44
-
45
-
46
-
47
-
48
-
49
-
50
-
51
-
52
-
53
-
54
-
55
-
56
-
57
-
58
-
59
-
60
-
61
-
62
-
63
-
64
-
 65
65 -
 66
66 -
 67
67 -
 68
68 -
 69
69 -
 70
70 -
 71
71 -
 72
72 -
 73
73 -
 74
74 -
 75
75 -
 76
76 -
 77
77 -
 78
78 -
 79
79 -
 80
80 -
 81
81 -
 82
82 -
 83
83 -
 84
84 -
 85
85 -
86
-
87
-
88
-
89
-
90
-
91
-
92
-
93
-
94
-
95
-
96
-
97
-
98
-
99
-
100
-
101
-
102
-
103
-
104
-
105
-
106
-
107
-
108
-
109
-
110
-
111
-
112
-
113
-
114
-
115
-
116
-
117
-
118
-
119
-
120
-
121
-
122
-
123
-
124
-
125
-
126
-
127
-
128
-
129
-
130
-
131
-
132
-
133
-
134
-
135
-
136
-
137
-
138
-
139
-
140
-
141
-
142
-
143
-
144
-
145
-
146
-
147
-
148
-
149
-
150
-
151
-
152
-
153
-
154
-
155
-
156
-
157
-
158
-
159
-
160
-
161
-
162
-
163
-
164
-
165
-
166
-
167
-
168
-
169
-
170
-
171
-
172
-
173
-
174
-
175
-
176
-
177
-
178
-
179
-
180
-
181
-
182
-
183
-
184
-
185
-
186
-
187
-
188
-
189
-
190
-
191
-
192
-
193
-
194
-
195
-
196
-
197
-
198
-
199
-
200
-
201
-
202
-
203
-
204
-
205
-
206
-
207
-
208
-
209
-
210
-
211
-
212
-
213
-
214
-
215
-
216
-
217
-
218
-
219
-
220
-
221
-
222
-
223
-
224
-
225
-
226
-
227
-
228
-
229
-
230
-
231
-
232
-
233
-
234
-
235
-
236
-
237
-
238
-
239
-
240
-
241
-
242
-
243
-
244
-
245
-
246
-
247
-
248
-
249
-
250
-
251
-
252
-
253
-
254
-
255
-
256
-
257
-
258
-
259
-
260
-
261
-
262
-
263
-
264
-
265
-
266
-
267
-
268
-
269
-
270
-
271
-
272
-
273
-
274
-
275
-
276
-
277
-
278
-
279
-
280
-
281
-
282
-
283
-
284
-
285
-
286
-
287
-
288
-
289
-
290
-
291
-
292
-
293
-
294
-
295
-
296
-
297
-
298
-
299
-
300
-
301
-
302
-
303
-
304
-
305
-
306
-
307
-
308
-
309
-
310
-
311
-
312
-
313
-
314
-
315
-
316
-
317
-
318
-
319
-
320
-
321
-
322
-
323
-
324
-
325
-
326
-
327
-
328
-
329
-
330
-
331
-
332
 |
 |

SUSTAINABLE DEVELOPMENT
SCHNEIDER ELECTRIC’S COMMITMENT TO ENVIRONMENTAL PERFORMANCE
demonstrating Schneider Electric’s expertise to its customers;
l
Resource Advisor is Schneider Electric’s enterprise-level
StruxureWare software application and part of the EcoStruxure
raising employees’ awareness about new energy efficiency
l
architecture. Resource Advisor provides secure access to data,
solutions and their own contribution to product development. reports and summaries to drive energy and sustainability
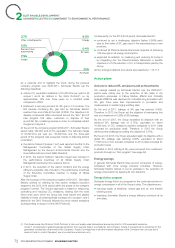
Around 10% of total Group emissions come from energy programs.
consumption at its sites (according to the carbon footprint Energy Operation is Schneider Electric’s operations-level
of2013). Since2005, Schneider Electric has fixed annual StruxureWare software application, part of EcoStruxure. Energy
objectives for reduction and publishes (internally) the energy Operation provides a data visualization and analysis application
consumption of each of its production and logistics sites each that aggregates volumes of raw energy data into actionable
year, as part of the Schneider Energy Action program. The Group information. As a cloud-based software as a service (SaaS) model,
met and in some cases exceeded its objective of reducing energy
2
it gives reduced solution cost, increased data storage capacity,
consumption per production site employee by 10% between 2005 and a very flexible and mobile energy solution enhanced by
and 2008. The 2009-2011 objective of -4% per year and per Schneider Electric expert services.
employee was also achieved overall at the end of2011.
The Green IT program
The 2012-2014 company program, Connect, includes the
following objectives: Green IT is a program to reduce the electrical consumption of
reduction of energy consumption by 10% over three years
l
Schneider Electric’s IT infrastructure (data centers, servers and IT
compared to2011; devices). It addresses all phases of the life cycle of IT devices and
involves a close partnership with our equipment and services
reporting of energy bills and roll-out of the StruxureWare
l
suppliers to reduce their carbon footprint.
Resource Advisor software for all sites with more than 5,000m²;
roll-out of StruxureWare Energy Operation at those sites for
l
The main objectives are:
real-time monitoring; to optimize the number of data centers and their energy
l
certification of energy management systems pursuant to the
l
management using Schneider Electric products and solutions;
ISO50001 standard for 20sites; to ensure the continuous training of our IT teams,
l
identification of opportunities to reduce energy consumption
l
implementation of continuous improvement plans and best
over all sites as a result of the Energy Action audits. practices to reduce the use of electricity of all IT devices from
the data centers to the end user;
The Schneider Energy Action program uses Schneider Electric
energy service activities to identify opportunities in key areas which to increase the percentage of virtualization by moving physical
l
are HVAC (Heating, Ventilation, and Air Conditioning), certain servers to virtual server instances leveraging virtual and / or
equipment (such as air compressors), lighting and specific private cloud where possible.
industrial processes. The following measures were implemented in2013:
Many initiatives and awareness campaigns are implemented In Europe, business-facing infrastructure from Ballerup
l
internally to improve understanding of the short and long-term (Denmark) and Nykoping (Sweden) have been centralized to a
benefits of energy efficiency. There is also a dedicated Intranet site global datacenter reducing the energy consumption. The
that provides information on progress and the results obtained as London Bridge legacy datacenter has been moved to the
part of Schneider Energy Action. Swindon green datacenter taking advantage of its high Power
The program resulted in the following achievements from 2011 to Usage Effectiveness (ratio between the total energy consumed
end-2013: by the data center and the energy consumed by the servers
themselves) rating of 1.08. Further decommissioning and
adjusted energy savings of 8% in 2013 compared to2011
l
virtualization of physical servers have resulted in over 80% of
(climate and industrial businesses) for the 204 virtualization of Wintel servers.
highest-consumption sites, covering 85% of total Group energy Backlight display has been optimized on 15,000 France IP
consumption (on the reporting perimeter p.113-114); phones to reduce energy consumption.
connection of 334sites to StruxureWare Energy Operation;
l
In North America, a transformation program to virtualize and
l
connection of 263sites to StruxureWare Resource Advisor;
l
centralize infrastructure began in 2013. One of the benefits of
ISO50001 certification of 65sites;
l
this program will be the reduction of power consumption in the
221 sites with an energy manager and an energy reduction
l
distributed, less efficient sites by virtualization and centralization
action plan; to a more efficient hosting option in the existing Saint Louis
datacenter. The virtualization percentage in the Saint Louis
around EUR11million invested in energy efficiency projects,
l
datacenter is greater than 70percent, most of this residing on
generally with a return on investment of less than three years; the VCE VBlock infrastructure, a solution provided by Schneider
around EUR2.7million monetary savings and 40million kWh
l
Electric IT Business to its customers. In 2013, between
energy savings. virtualization and decommissioning, the Group has retired 65
Energy Operation and Resource Advisor are software suites that physical servers which account for approximatively 20kW or
are part of the Schneider Electric StruxureWare platform, which 175,000 kWh peryear.
helps customers in any market segment and across all geographic
areas to maximize their business performance while conserving
their resources, including energy. Energy Operation is applied at
the operations level and Resource Advisor is applied at the
company level.
73
2013 REGISTRATION DOCUMENT SCHNEIDER ELECTRIC