APC 2013 Annual Report Download - page 118
Download and view the complete annual report
Please find page 118 of the 2013 APC annual report below. You can navigate through the pages in the report by either clicking on the pages listed below, or by using the keyword search tool below to find specific information within the annual report.-
 1
1 -
2
-
3
-
4
-
5
-
6
-
7
-
8
-
9
-
10
-
11
-
12
-
13
-
14
-
15
-
16
-
17
-
18
-
19
-
20
-
21
-
22
-
23
-
24
-
25
-
26
-
27
-
28
-
29
-
30
-
31
-
32
-
33
-
34
-
35
-
36
-
37
-
38
-
39
-
40
-
41
-
42
-
43
-
44
-
45
-
46
-
47
-
48
-
49
-
50
-
51
-
52
-
53
-
54
-
55
-
56
-
57
-
58
-
59
-
60
-
61
-
62
-
63
-
64
-
65
-
66
-
67
-
68
-
69
-
70
-
71
-
72
-
73
-
74
-
75
-
76
-
77
-
78
-
79
-
80
-
81
-
82
-
83
-
84
-
85
-
86
-
87
-
88
-
89
-
90
-
91
-
92
-
93
-
94
-
95
-
96
-
97
-
98
-
99
-
100
-
101
-
102
-
103
-
104
-
105
-
106
-
107
-
 108
108 -
 109
109 -
 110
110 -
 111
111 -
 112
112 -
 113
113 -
 114
114 -
 115
115 -
 116
116 -
 117
117 -
 118
118 -
 119
119 -
 120
120 -
 121
121 -
 122
122 -
 123
123 -
 124
124 -
 125
125 -
 126
126 -
 127
127 -
 128
128 -
129
-
130
-
131
-
132
-
133
-
134
-
135
-
136
-
137
-
138
-
139
-
140
-
141
-
142
-
143
-
144
-
145
-
146
-
147
-
148
-
149
-
150
-
151
-
152
-
153
-
154
-
155
-
156
-
157
-
158
-
159
-
160
-
161
-
162
-
163
-
164
-
165
-
166
-
167
-
168
-
169
-
170
-
171
-
172
-
173
-
174
-
175
-
176
-
177
-
178
-
179
-
180
-
181
-
182
-
183
-
184
-
185
-
186
-
187
-
188
-
189
-
190
-
191
-
192
-
193
-
194
-
195
-
196
-
197
-
198
-
199
-
200
-
201
-
202
-
203
-
204
-
205
-
206
-
207
-
208
-
209
-
210
-
211
-
212
-
213
-
214
-
215
-
216
-
217
-
218
-
219
-
220
-
221
-
222
-
223
-
224
-
225
-
226
-
227
-
228
-
229
-
230
-
231
-
232
-
233
-
234
-
235
-
236
-
237
-
238
-
239
-
240
-
241
-
242
-
243
-
244
-
245
-
246
-
247
-
248
-
249
-
250
-
251
-
252
-
253
-
254
-
255
-
256
-
257
-
258
-
259
-
260
-
261
-
262
-
263
-
264
-
265
-
266
-
267
-
268
-
269
-
270
-
271
-
272
-
273
-
274
-
275
-
276
-
277
-
278
-
279
-
280
-
281
-
282
-
283
-
284
-
285
-
286
-
287
-
288
-
289
-
290
-
291
-
292
-
293
-
294
-
295
-
296
-
297
-
298
-
299
-
300
-
301
-
302
-
303
-
304
-
305
-
306
-
307
-
308
-
309
-
310
-
311
-
312
-
313
-
314
-
315
-
316
-
317
-
318
-
319
-
320
-
321
-
322
-
323
-
324
-
325
-
326
-
327
-
328
-
329
-
330
-
331
-
332
 |
 |

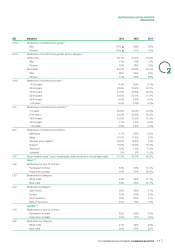
2SUSTAINABLE DEVELOPMENT
INDICATORS
Workforce
GRI Indicators 2013 2012 2011
Workforce
LA1 Average workforce(4) 163,033 ▲152,384 140,489
Blue collar (VDC)(4) 81,712 75,601 70,609
White collar (non-VDC)(4) 81,322 76,383 69,580
LA1 Average supplementary workforce 14,849 ▲13,947 13,924
LA1 Fixed-term contract and permanent contract personnel(5) 152,784 ▲139,989 137,535
Permanent contract 90.5% 90.2% 87.3%
Fixed-term contract 9.5% 9.8% 12.7%
LA1 Share of temporary personnel (fixed-term contracts andtemporaryworkers)(5) 17.7% 17.4% 20.5%
LA1 Organization of working time(3)
Full-time 98% 98% 97.9%
Part-time 2% 2% 2.1%
LA1 Hires(6) 23,079 ▲20,971 19,792
LA1 Departures(6) 21,600 20,615 16,362
Layoffs 5,071 ▲5,719 3,887
Resignations 10,909 ▲10,379 7,558
Others (retirement, end of contract,etc.) 5,743 4,489 4,917
LA1 Voluntary turnover 7.4% ▲7.5% 6%
LA1 Breakdown of workforce by region(5)
Asia-Pacific 30% 31% 31%
Europe 40% 38% 39%
North America 20% 21% 21%
Rest of the world 10% 10% 9%
LA1 Breakdown of workforce by country (the most significant countries)(5)
France 12% 14% 13%
United States of America 13% 13% 12%
China 10% 11% 10%
India 9% 9% 8%
Mexico 6% 5% 5%
Spain 4% 4% 4%
Brazil 4% 4% 3%
Germany 3% 3% 3%
Australia 2% 3% 3%
Indonesia 3% 3% 2%
United Kingdom 2% 2% 2%
Russia 8% 2% 2%
LA1 Annual change in workforce by country (the most significant countries)(5)
France -1% -4% -2%
United States of America +2% 0% +9%
China +1% -5% +29%
India +3% +6% +88%
Mexico +13% +3% +5%
Spain -9% -2% +74%
Germany -3% +2% +2%
Brazil +7% +21% +38%
Australia -3% -7% +22%
Indonesia +9% +33% +10%
United Kingdom -5% +6% +8%
Russia +269% +3% -1%
116 2013 REGISTRATION DOCUMENT SCHNEIDER ELECTRIC