APC 2013 Annual Report Download - page 117
Download and view the complete annual report
Please find page 117 of the 2013 APC annual report below. You can navigate through the pages in the report by either clicking on the pages listed below, or by using the keyword search tool below to find specific information within the annual report.-
 1
1 -
2
-
3
-
4
-
5
-
6
-
7
-
8
-
9
-
10
-
11
-
12
-
13
-
14
-
15
-
16
-
17
-
18
-
19
-
20
-
21
-
22
-
23
-
24
-
25
-
26
-
27
-
28
-
29
-
30
-
31
-
32
-
33
-
34
-
35
-
36
-
37
-
38
-
39
-
40
-
41
-
42
-
43
-
44
-
45
-
46
-
47
-
48
-
49
-
50
-
51
-
52
-
53
-
54
-
55
-
56
-
57
-
58
-
59
-
60
-
61
-
62
-
63
-
64
-
65
-
66
-
67
-
68
-
69
-
70
-
71
-
72
-
73
-
74
-
75
-
76
-
77
-
78
-
79
-
80
-
81
-
82
-
83
-
84
-
85
-
86
-
87
-
88
-
89
-
90
-
91
-
92
-
93
-
94
-
95
-
96
-
97
-
98
-
99
-
100
-
101
-
102
-
103
-
104
-
105
-
106
-
 107
107 -
 108
108 -
 109
109 -
 110
110 -
 111
111 -
 112
112 -
 113
113 -
 114
114 -
 115
115 -
 116
116 -
 117
117 -
 118
118 -
 119
119 -
 120
120 -
 121
121 -
 122
122 -
 123
123 -
 124
124 -
 125
125 -
 126
126 -
 127
127 -
128
-
129
-
130
-
131
-
132
-
133
-
134
-
135
-
136
-
137
-
138
-
139
-
140
-
141
-
142
-
143
-
144
-
145
-
146
-
147
-
148
-
149
-
150
-
151
-
152
-
153
-
154
-
155
-
156
-
157
-
158
-
159
-
160
-
161
-
162
-
163
-
164
-
165
-
166
-
167
-
168
-
169
-
170
-
171
-
172
-
173
-
174
-
175
-
176
-
177
-
178
-
179
-
180
-
181
-
182
-
183
-
184
-
185
-
186
-
187
-
188
-
189
-
190
-
191
-
192
-
193
-
194
-
195
-
196
-
197
-
198
-
199
-
200
-
201
-
202
-
203
-
204
-
205
-
206
-
207
-
208
-
209
-
210
-
211
-
212
-
213
-
214
-
215
-
216
-
217
-
218
-
219
-
220
-
221
-
222
-
223
-
224
-
225
-
226
-
227
-
228
-
229
-
230
-
231
-
232
-
233
-
234
-
235
-
236
-
237
-
238
-
239
-
240
-
241
-
242
-
243
-
244
-
245
-
246
-
247
-
248
-
249
-
250
-
251
-
252
-
253
-
254
-
255
-
256
-
257
-
258
-
259
-
260
-
261
-
262
-
263
-
264
-
265
-
266
-
267
-
268
-
269
-
270
-
271
-
272
-
273
-
274
-
275
-
276
-
277
-
278
-
279
-
280
-
281
-
282
-
283
-
284
-
285
-
286
-
287
-
288
-
289
-
290
-
291
-
292
-
293
-
294
-
295
-
296
-
297
-
298
-
299
-
300
-
301
-
302
-
303
-
304
-
305
-
306
-
307
-
308
-
309
-
310
-
311
-
312
-
313
-
314
-
315
-
316
-
317
-
318
-
319
-
320
-
321
-
322
-
323
-
324
-
325
-
326
-
327
-
328
-
329
-
330
-
331
-
332
 |
 |

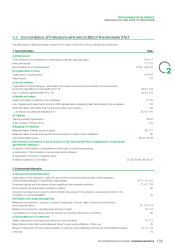
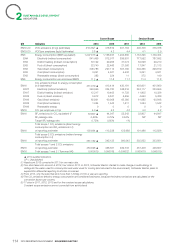
SUSTAINABLE DEVELOPMENT
INDICATORS
Key performance indicators from the Planet&Society Barometer
Objectives for year end 2014 2013 2012 2011
1. 10% CO2 savings on transportation 16.7% ▲14.8% -
2. 75% of our product revenues achieved with Green Premium 68.7% ▲65.5% 63%
3. 10% energy consumption savings 8% ▲6.1% -
The 2011 performance serves as a starting value for the Planet&Society Barometer Connect program between 2012 and 2014.
▲ 2013 Audited Indicators.
Please refer to pages 105 to 108 for the methodological presentation of indicators and the following pages for the analysis of the results
(pages 74 for indicator1, 75-77 for indicator2 and 72-73 for indicator 3).
2
CO2 emissions in transportation (scope 3)
Indicators 2013 2012 2011
1. CO2 emissions on transportation paid by the Group (in tons of CO2e) 438,975 ▲393,765 497,703
▲ 2013 audited indicators. Calculation based on a coverage of 81% extrapolated to 100%.
Please refer to page74 for the presentation of this program.
For complete carbon footprint of Schneider Electric (scopes 1, 2 and 3), please refer to pages 71-72
Other key performance indicator
Objectives for year end 2014 2013 2012 2011
1. 15 countries are implementing a recovery process for SF6 gas 13 10 8
i.e. SF6 gas recovered and recycled (in CO2 equivalent t) 15,996 29,583 UP
UP =Unpublished.
Please refer to page64 for the presentation of this program.
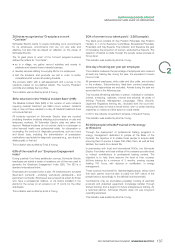
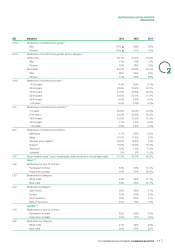
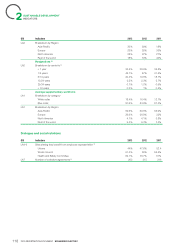
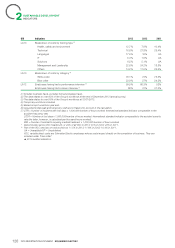
Social indicators
7.2
The indicators below have a Group scope. The social indicators count the people with fixed-term contracts,
on work-experience and on permanent contracts. The indicators
The Safety data of the sites are included in the Group metrics after
that also include temporary workers and/or subcontractors on site
one complete calendar year following their creation or acquisition. A
are indicated by footnotes.
site joining the Group in year n will be included in the metrics on
January1 n+2, except in exceptional circumstances when contract
The calculation methodology of the absenteeism rate varying from
language stipulates not to include the Safety data before two years. A
a country to the other, in this domain Schneider Electric
gap can be thus recorded with the scope of financial consolidation.
communicates at Group level the number of lost days and the
number of hours worked (Safety data).
HR data cover 100% of the workforce from integrated companies
(see rules page105). Certain indicators cover 83% or 90% of the The comments on the indicators are given in the matching
workforce; they are indicated by the footnotes at the bottom of the chapters and indicated in the tables below.
page. The precisions on the variations of scope are contributed at The table below indicates the matching of indicators with the
the end of the tables below and indicated byfootnotes. Global Reporting Initiative.
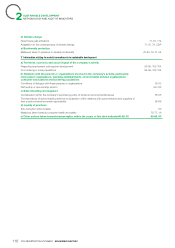
Key performance indicators from the Planet & Society Barometer
Objectives for Year-End-2014 2013 2012 2011
1. 30% reduction in the Medical Incident Rate (MIR) - 47% ▲- 23% -
2. 63%* result in our Employee Engagement Index 60% ▲55% -
3. 30% women in our talent pool (~2,500people) 28% ▲27% 23%
4. 1 day of training for each employee every year 67% ▲-** -
5. 300 sites recognized “Great place to work – Cool sites” 224 ▲-** -
The 2011 performance serves as a starting value for the Planet&Society Barometer of the Connect program between 2012 and 2014.
▲ 2013 audited indicators.
* A new target has been set from 2014 for this indicator: 63% instead of 70% at end-2014. With 63%, the Group gives itself the challenge to
be 10 points above its industry average (source: Aon Hewitt).
** These indicators are reported from 2013. The reporting tools have been deployed during 2012.
Please refer to pages105 to 108 for the methodological presentation of indicators and the following pages for the analysis of the results
(pages81-83 for indicator1, 83-84 for indicator2, 89 for indicator3, 87 for indicator4 and 84 for indicator5).
115
2013 REGISTRATION DOCUMENT SCHNEIDER ELECTRIC