APC 2013 Annual Report Download - page 83
Download and view the complete annual report
Please find page 83 of the 2013 APC annual report below. You can navigate through the pages in the report by either clicking on the pages listed below, or by using the keyword search tool below to find specific information within the annual report.-
 1
1 -
2
-
3
-
4
-
5
-
6
-
7
-
8
-
9
-
10
-
11
-
12
-
13
-
14
-
15
-
16
-
17
-
18
-
19
-
20
-
21
-
22
-
23
-
24
-
25
-
26
-
27
-
28
-
29
-
30
-
31
-
32
-
33
-
34
-
35
-
36
-
37
-
38
-
39
-
40
-
41
-
42
-
43
-
44
-
45
-
46
-
47
-
48
-
49
-
50
-
51
-
52
-
53
-
54
-
55
-
56
-
57
-
58
-
59
-
60
-
61
-
62
-
63
-
64
-
65
-
66
-
67
-
68
-
69
-
70
-
71
-
72
-
 73
73 -
 74
74 -
 75
75 -
 76
76 -
 77
77 -
 78
78 -
 79
79 -
 80
80 -
 81
81 -
 82
82 -
 83
83 -
 84
84 -
 85
85 -
 86
86 -
 87
87 -
 88
88 -
 89
89 -
 90
90 -
 91
91 -
 92
92 -
 93
93 -
94
-
95
-
96
-
97
-
98
-
99
-
100
-
101
-
102
-
103
-
104
-
105
-
106
-
107
-
108
-
109
-
110
-
111
-
112
-
113
-
114
-
115
-
116
-
117
-
118
-
119
-
120
-
121
-
122
-
123
-
124
-
125
-
126
-
127
-
128
-
129
-
130
-
131
-
132
-
133
-
134
-
135
-
136
-
137
-
138
-
139
-
140
-
141
-
142
-
143
-
144
-
145
-
146
-
147
-
148
-
149
-
150
-
151
-
152
-
153
-
154
-
155
-
156
-
157
-
158
-
159
-
160
-
161
-
162
-
163
-
164
-
165
-
166
-
167
-
168
-
169
-
170
-
171
-
172
-
173
-
174
-
175
-
176
-
177
-
178
-
179
-
180
-
181
-
182
-
183
-
184
-
185
-
186
-
187
-
188
-
189
-
190
-
191
-
192
-
193
-
194
-
195
-
196
-
197
-
198
-
199
-
200
-
201
-
202
-
203
-
204
-
205
-
206
-
207
-
208
-
209
-
210
-
211
-
212
-
213
-
214
-
215
-
216
-
217
-
218
-
219
-
220
-
221
-
222
-
223
-
224
-
225
-
226
-
227
-
228
-
229
-
230
-
231
-
232
-
233
-
234
-
235
-
236
-
237
-
238
-
239
-
240
-
241
-
242
-
243
-
244
-
245
-
246
-
247
-
248
-
249
-
250
-
251
-
252
-
253
-
254
-
255
-
256
-
257
-
258
-
259
-
260
-
261
-
262
-
263
-
264
-
265
-
266
-
267
-
268
-
269
-
270
-
271
-
272
-
273
-
274
-
275
-
276
-
277
-
278
-
279
-
280
-
281
-
282
-
283
-
284
-
285
-
286
-
287
-
288
-
289
-
290
-
291
-
292
-
293
-
294
-
295
-
296
-
297
-
298
-
299
-
300
-
301
-
302
-
303
-
304
-
305
-
306
-
307
-
308
-
309
-
310
-
311
-
312
-
313
-
314
-
315
-
316
-
317
-
318
-
319
-
320
-
321
-
322
-
323
-
324
-
325
-
326
-
327
-
328
-
329
-
330
-
331
-
332
 |
 |

SUSTAINABLE DEVELOPMENT
COMMITTED TO AND ON BEHALF OF EMPLOYEES
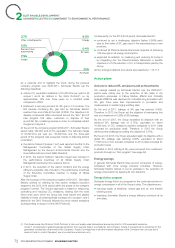
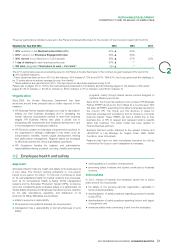
Three key performance indicators were set in the Planet and Society Barometer for the duration of the Connect program (2012-2014):
Objectives for Year-End-2014 2013 2012 2011
1. 30% reduction in the Medical Incident Rate (MIR) -47% ▲-23% -
2. 63%* result in our Employee Engagement Index 60% ▲55% -
3. 30% women in our talent pool (~2,500people) 28% ▲27% 23%
4. 1 day of training for each employee every year 67% ▲-** -
5. 300 sites recognized “Great place to work – Cool sites” 224 ▲-** - 2
The 2011 performance serves as a starting value for the Planet&Society Barometer of the Connect program between 2012 and 2014.
▲ 2013 audited indicators.
* A new target has been set from 2014 for this indicator: 63% instead of 70% at end-2014. With 63%, the Group gives itself the challenge to
be 10 points above its industry average (source: Aon Hewitt).
** These indicators are reported from 2013. The reporting tools have been deployed during 2012.
Please refer to pages105 to 108 for the methodological presentation of indicators and the following pages for the analysis of the results
(pages81-83 for indicator1, 83-84 for indicator2, 89 for indicator3, 87 for indicator4 and 84 for indicator5).
Organization
programs, mainly through shared service centers designed to
optimize efficiency and costs.
Since2009, the Human Resources Department has been Since 2012, the Group has created a more coherent HR Business
structured around three principal roles to better respond to their Partner (HRBP) structure for front offices at a country level. With
missions: this step, all HRBPs supporting front office businesses reported to
HR Business Partner assists managers on a day-to-day basis in
l
the Country HR. The Group put this structure in place for
setting out their business strategies and in assessing the improved coverage and consistency and for access to a broader
human resource requirements needed to meet their business local job market. These HRBPs will have a dotted line to their
targets. HR Business Partner also plays a pivotal role in business (line or HR) to respect and represent what is specific
anticipating skill requirements and employee development, and about that business. The same model has been applied to
in the management of employee relations; Finance Business partners.
HR Solutions creates and develops comprehensive solutions to
l
Business Partners remain attached to the relevant Finance and
the organization’s strategic challenges in key areas, such as HRSVP/VP or Line Manager for: Supply Chain, R&D, Global
compensation, benefits, human capital development, training Functions, Lines of business.
and performance management. Regional teams are leveraged Regional roles have not been immediately impacted but will be
to effectively shadow the Group’s globalised operations; reviewed by the Group to see if adaptation is necessary.
HR Operations handles the logistics and administrative
l
responsibilities relating to payroll, sourcing, mobility and training
Employee health and safety
4.2
Approach
working safely is a condition of employment;
l
preventing safety incidents and injuries contributes to business
l
Schneider Electric holds the health and safety of its employees as success.
a core value. The Group’s working philosophy is “one person
Action plans
injured is one person too many”. To that end, it continues to build
on its well-established health and safety systems and processes, In 2013, reviews of hazards and employee injuries led to action
such as its Occupational Health & Safety (OHS) management plans around four focus areas:
systems and the Schneider Production System (SPS), to improve
the safety of the growing services organization, especially in
l
upon and consistently apply workplace safety on a global basis. Its
terms of electrical safety;
Global Safety Directives and Employee Handbook set the direction
for the safe manufacture, assembly, and distribution of its standardization of safety practices regarding powered industrial
l
products. Its Safety Mandates are as follows: trucks (PITs);
safety is everyone’s responsibility;
l
standardization of safety practices regarding lockout and tagout
l
of equipment;and
all injuries and occupational illnesses can be prevented;
l
employee safety while commuting to and from the workplace.
l
management has a responsibility to train all employees to work
l
safely;
81
2013 REGISTRATION DOCUMENT SCHNEIDER ELECTRIC