APC 2013 Annual Report Download - page 6
Download and view the complete annual report
Please find page 6 of the 2013 APC annual report below. You can navigate through the pages in the report by either clicking on the pages listed below, or by using the keyword search tool below to find specific information within the annual report.-
 1
1 -
 2
2 -
 3
3 -
 4
4 -
 5
5 -
 6
6 -
 7
7 -
 8
8 -
 9
9 -
 10
10 -
 11
11 -
 12
12 -
 13
13 -
 14
14 -
 15
15 -
 16
16 -
 17
17 -
18
-
19
-
20
-
21
-
22
-
23
-
24
-
25
-
26
-
27
-
28
-
29
-
30
-
31
-
32
-
33
-
34
-
35
-
36
-
37
-
38
-
39
-
40
-
41
-
42
-
43
-
44
-
45
-
46
-
47
-
48
-
49
-
50
-
51
-
52
-
53
-
54
-
55
-
56
-
57
-
58
-
59
-
60
-
61
-
62
-
63
-
64
-
65
-
66
-
67
-
68
-
69
-
70
-
71
-
72
-
73
-
74
-
75
-
76
-
77
-
78
-
79
-
80
-
81
-
82
-
83
-
84
-
85
-
86
-
87
-
88
-
89
-
90
-
91
-
92
-
93
-
94
-
95
-
96
-
97
-
98
-
99
-
100
-
101
-
102
-
103
-
104
-
105
-
106
-
107
-
108
-
109
-
110
-
111
-
112
-
113
-
114
-
115
-
116
-
117
-
118
-
119
-
120
-
121
-
122
-
123
-
124
-
125
-
126
-
127
-
128
-
129
-
130
-
131
-
132
-
133
-
134
-
135
-
136
-
137
-
138
-
139
-
140
-
141
-
142
-
143
-
144
-
145
-
146
-
147
-
148
-
149
-
150
-
151
-
152
-
153
-
154
-
155
-
156
-
157
-
158
-
159
-
160
-
161
-
162
-
163
-
164
-
165
-
166
-
167
-
168
-
169
-
170
-
171
-
172
-
173
-
174
-
175
-
176
-
177
-
178
-
179
-
180
-
181
-
182
-
183
-
184
-
185
-
186
-
187
-
188
-
189
-
190
-
191
-
192
-
193
-
194
-
195
-
196
-
197
-
198
-
199
-
200
-
201
-
202
-
203
-
204
-
205
-
206
-
207
-
208
-
209
-
210
-
211
-
212
-
213
-
214
-
215
-
216
-
217
-
218
-
219
-
220
-
221
-
222
-
223
-
224
-
225
-
226
-
227
-
228
-
229
-
230
-
231
-
232
-
233
-
234
-
235
-
236
-
237
-
238
-
239
-
240
-
241
-
242
-
243
-
244
-
245
-
246
-
247
-
248
-
249
-
250
-
251
-
252
-
253
-
254
-
255
-
256
-
257
-
258
-
259
-
260
-
261
-
262
-
263
-
264
-
265
-
266
-
267
-
268
-
269
-
270
-
271
-
272
-
273
-
274
-
275
-
276
-
277
-
278
-
279
-
280
-
281
-
282
-
283
-
284
-
285
-
286
-
287
-
288
-
289
-
290
-
291
-
292
-
293
-
294
-
295
-
296
-
297
-
298
-
299
-
300
-
301
-
302
-
303
-
304
-
305
-
306
-
307
-
308
-
309
-
310
-
311
-
312
-
313
-
314
-
315
-
316
-
317
-
318
-
319
-
320
-
321
-
322
-
323
-
324
-
325
-
326
-
327
-
328
-
329
-
330
-
331
-
332
 |
 |

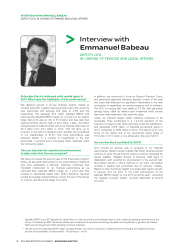
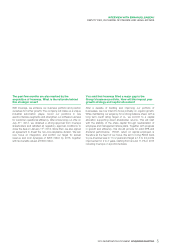
INTERVIEW WITH EMMANUEL BABEAU
DEPUTY CEO, IN CHARGE OF FINANCE AND LEGAL AFFAIRS
Interview with
Emmanuel Babeau
DEPUTY CEO,
IN CHARGE OF FINANCE AND LEGAL AFFAIRS
Schneider Electric delivered solid results again in In addition, we continued to focus on Support Function Costs,
2013. What were the highlights of this performance? and generated significant efficiency savings in each of the past
two years that balanced our significant investments in the new
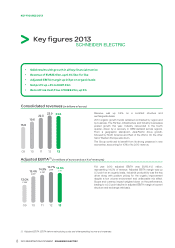
We delivered growth in all key financial metrics, thanks to economies, in expanding our service presence and in software.
focused execution. Organic revenue growth was 0.4%, driven by The SFC to revenue ratio was stable at 23.3%, with generated
new economies and services that grew at 4.6% and 9% savings being offset by inflation and investment while volume
respectively. We delivered €3.4 billion adjusted EBITA* and was lower-than-expected in the past two years.
improved the adjusted EBITA margin by 0.3 point on an organic Lastly, our Tailored Supply Chain initiatives continued to be
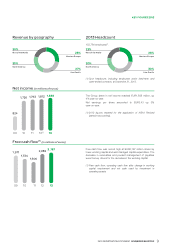
basis. Net profit was up 4% to €1.9 billion and free cash flow successful. They contributed to a 1.5point reduction of the
reached another all-time high of €2.2 billion. Lastly, we further inventory to revenue ratio while improving customer satisfaction,
strengthened our balance sheet with a net financial debt down to and generated €358 million of industrial productivity gains in
€3.3 billion from €4.4 billion in 2012. This will allow us to 2013, compared to €289 million in 2012. This allows us to now
propose, in line with our dividend policy, another strong dividend focus on the higher end of our productivity target range of
to our shareholders of €1.87. This solid performance was €1.0billion to €1.1billion, to be achieved by the end of 2014.
achieved thanks to a number of investments in the new
Are you therefore confident for 2014?
economies, in services and in the supply chain, deployed under
the Connect program.
Can you describe the operational achievements 2014 should be another year of progress of our financial
performance. Recent trends indicate that North America should
to date under this Connect program? continue to grow though the first quarter would be impacted by
severe weather. Western Europe is showing initial signs of
We have just closed the second year of this three-year program. stabilization with potential for improvement in the second half.
Firstly, we see solid improvement of our performance in Solutions End-market trends in China continue to be solid. Uncertainty
and more particularly in Services. Solutions confirmed their remains in several new economies due to currency volatility.
important contribution to our financial performance as we Based on this, the Group targets low single-digit organic growth
improved their adjusted EBITA margin by 1 point and their in revenue and 0.4 point to 0.8 point improvement of the
revenue to operational assets ratio. Within Solutions, Services adjusted EBITA margin vs. the 2013 proforma level** excluding
posted an average outperformance versus the rest of the Group the negative currency impact, currently estimated at around
of 7 points, well above the target of 5 points. 0.4point.
* Adjusted EBITA is an EBIT adjusted for certain items in order to provide a more relevant basis for the underlying operating performance of the
Group. It is defined as: EBIT before amortization and impairment of purchase accounting intangibles and impairment of goodwill, and before
Restructuring charges and Other operating income & expenses.
** The 2013 proforma adjusted EBITA margin including the last 12 months of Invensys to September 2013 (excluding the Appliance division)
and the full consolidation of Electroshield - TM Samara is ~14.0%.
42013 REGISTRATION DOCUMENT SCHNEIDER ELECTRIC