APC 2013 Annual Report Download - page 287
Download and view the complete annual report
Please find page 287 of the 2013 APC annual report below. You can navigate through the pages in the report by either clicking on the pages listed below, or by using the keyword search tool below to find specific information within the annual report.-
 1
1 -
2
-
3
-
4
-
5
-
6
-
7
-
8
-
9
-
10
-
11
-
12
-
13
-
14
-
15
-
16
-
17
-
18
-
19
-
20
-
21
-
22
-
23
-
24
-
25
-
26
-
27
-
28
-
29
-
30
-
31
-
32
-
33
-
34
-
35
-
36
-
37
-
38
-
39
-
40
-
41
-
42
-
43
-
44
-
45
-
46
-
47
-
48
-
49
-
50
-
51
-
52
-
53
-
54
-
55
-
56
-
57
-
58
-
59
-
60
-
61
-
62
-
63
-
64
-
65
-
66
-
67
-
68
-
69
-
70
-
71
-
72
-
73
-
74
-
75
-
76
-
77
-
78
-
79
-
80
-
81
-
82
-
83
-
84
-
85
-
86
-
87
-
88
-
89
-
90
-
91
-
92
-
93
-
94
-
95
-
96
-
97
-
98
-
99
-
100
-
101
-
102
-
103
-
104
-
105
-
106
-
107
-
108
-
109
-
110
-
111
-
112
-
113
-
114
-
115
-
116
-
117
-
118
-
119
-
120
-
121
-
122
-
123
-
124
-
125
-
126
-
127
-
128
-
129
-
130
-
131
-
132
-
133
-
134
-
135
-
136
-
137
-
138
-
139
-
140
-
141
-
142
-
143
-
144
-
145
-
146
-
147
-
148
-
149
-
150
-
151
-
152
-
153
-
154
-
155
-
156
-
157
-
158
-
159
-
160
-
161
-
162
-
163
-
164
-
165
-
166
-
167
-
168
-
169
-
170
-
171
-
172
-
173
-
174
-
175
-
176
-
177
-
178
-
179
-
180
-
181
-
182
-
183
-
184
-
185
-
186
-
187
-
188
-
189
-
190
-
191
-
192
-
193
-
194
-
195
-
196
-
197
-
198
-
199
-
200
-
201
-
202
-
203
-
204
-
205
-
206
-
207
-
208
-
209
-
210
-
211
-
212
-
213
-
214
-
215
-
216
-
217
-
218
-
219
-
220
-
221
-
222
-
223
-
224
-
225
-
226
-
227
-
228
-
229
-
230
-
231
-
232
-
233
-
234
-
235
-
236
-
237
-
238
-
239
-
240
-
241
-
242
-
243
-
244
-
245
-
246
-
247
-
248
-
249
-
250
-
251
-
252
-
253
-
254
-
255
-
256
-
257
-
258
-
259
-
260
-
261
-
262
-
263
-
264
-
265
-
266
-
267
-
268
-
269
-
270
-
271
-
272
-
273
-
274
-
275
-
276
-
 277
277 -
 278
278 -
 279
279 -
 280
280 -
 281
281 -
 282
282 -
 283
283 -
 284
284 -
 285
285 -
 286
286 -
 287
287 -
 288
288 -
 289
289 -
 290
290 -
 291
291 -
 292
292 -
 293
293 -
 294
294 -
 295
295 -
 296
296 -
 297
297 -
298
-
299
-
300
-
301
-
302
-
303
-
304
-
305
-
306
-
307
-
308
-
309
-
310
-
311
-
312
-
313
-
314
-
315
-
316
-
317
-
318
-
319
-
320
-
321
-
322
-
323
-
324
-
325
-
326
-
327
-
328
-
329
-
330
-
331
-
332
 |
 |

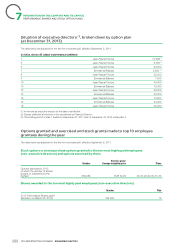
INFORMATION ON THE COMPANY AND ITS CAPITAL
PERFORMANCE SHARES AND STOCK OPTION PLANS
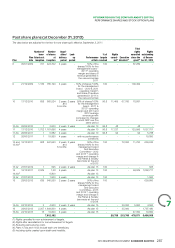
Past stock option plans
The data below are adjusted for the two-for-one share split, effective September2, 2011.
Options Options
Number of Number of of which Exercise % of cancelled by outstanding at
Performance beneficiaries options at executive price targets performance December31,
Plan datePlan at inception inception directors (in euros) criteria reached criteria (1) 2013 (2)
Without – plan reserved
25 12/05/2005 157 277,000 - 28.23 NA NA -to winners of the trophy
50% of options – 2005
and2006 operating
26 28/06/2005 458 4,007,600 400,000 30.09 100 - -margin andrevenue
50% of options – 2006
and2007 operating
27 01/12/2005 419 3,229,800 300,000 35.70 100 - -margin andrevenue
50% of options – 2007
and2008 operating
28 21/12/2006 489 2,514,240 224,000 40.67 100 - 867,055margin andrevenue
50% of options – 2007
and2008 operating
29 23/04/2007 43 166,300 - 48.52 100 - 70,875margin andrevenue
50% of options – 2008
and2009 operating
30 19/12/2007 542 1,889,852 176,400 46.00 - 887,952 476,827margin andrevenue
50% of options/100% for
themanagement board –
2011 operating margin (4)
and2009 to2011 EPS
compared to a
31 05/01/2009 328 1,358,000 137,000 26.06 80 133,760 557,359benchmarkselection(3)
32 21/08/2009 1 10,000 10,000 31.30 without - - -
50% of options/100% for
the management board –
2010 and2011 operating
margin (2) and2011 share
of revenue generated in
33 21/12/2009 391 1,652,686 130,000 37.92 100 - 1,336,114the neweconomies
15,105,478 1,377,400 - 1,021,712 3,308,230
Number of options remaining to be exercised after deduction of all cancellations and exercises since plan implementation.(1)
Excluding restructuring costs.(2)
On the basis of a pre-defined and fixed list of 11 competitor companies.(3)
7
285
2013 REGISTRATION DOCUMENT SCHNEIDER ELECTRIC