APC 2013 Annual Report Download - page 180
Download and view the complete annual report
Please find page 180 of the 2013 APC annual report below. You can navigate through the pages in the report by either clicking on the pages listed below, or by using the keyword search tool below to find specific information within the annual report.-
 1
1 -
2
-
3
-
4
-
5
-
6
-
7
-
8
-
9
-
10
-
11
-
12
-
13
-
14
-
15
-
16
-
17
-
18
-
19
-
20
-
21
-
22
-
23
-
24
-
25
-
26
-
27
-
28
-
29
-
30
-
31
-
32
-
33
-
34
-
35
-
36
-
37
-
38
-
39
-
40
-
41
-
42
-
43
-
44
-
45
-
46
-
47
-
48
-
49
-
50
-
51
-
52
-
53
-
54
-
55
-
56
-
57
-
58
-
59
-
60
-
61
-
62
-
63
-
64
-
65
-
66
-
67
-
68
-
69
-
70
-
71
-
72
-
73
-
74
-
75
-
76
-
77
-
78
-
79
-
80
-
81
-
82
-
83
-
84
-
85
-
86
-
87
-
88
-
89
-
90
-
91
-
92
-
93
-
94
-
95
-
96
-
97
-
98
-
99
-
100
-
101
-
102
-
103
-
104
-
105
-
106
-
107
-
108
-
109
-
110
-
111
-
112
-
113
-
114
-
115
-
116
-
117
-
118
-
119
-
120
-
121
-
122
-
123
-
124
-
125
-
126
-
127
-
128
-
129
-
130
-
131
-
132
-
133
-
134
-
135
-
136
-
137
-
138
-
139
-
140
-
141
-
142
-
143
-
144
-
145
-
146
-
147
-
148
-
149
-
150
-
151
-
152
-
153
-
154
-
155
-
156
-
157
-
158
-
159
-
160
-
161
-
162
-
163
-
164
-
165
-
166
-
167
-
168
-
169
-
 170
170 -
 171
171 -
 172
172 -
 173
173 -
 174
174 -
 175
175 -
 176
176 -
 177
177 -
 178
178 -
 179
179 -
 180
180 -
 181
181 -
 182
182 -
 183
183 -
 184
184 -
 185
185 -
 186
186 -
 187
187 -
 188
188 -
 189
189 -
 190
190 -
191
-
192
-
193
-
194
-
195
-
196
-
197
-
198
-
199
-
200
-
201
-
202
-
203
-
204
-
205
-
206
-
207
-
208
-
209
-
210
-
211
-
212
-
213
-
214
-
215
-
216
-
217
-
218
-
219
-
220
-
221
-
222
-
223
-
224
-
225
-
226
-
227
-
228
-
229
-
230
-
231
-
232
-
233
-
234
-
235
-
236
-
237
-
238
-
239
-
240
-
241
-
242
-
243
-
244
-
245
-
246
-
247
-
248
-
249
-
250
-
251
-
252
-
253
-
254
-
255
-
256
-
257
-
258
-
259
-
260
-
261
-
262
-
263
-
264
-
265
-
266
-
267
-
268
-
269
-
270
-
271
-
272
-
273
-
274
-
275
-
276
-
277
-
278
-
279
-
280
-
281
-
282
-
283
-
284
-
285
-
286
-
287
-
288
-
289
-
290
-
291
-
292
-
293
-
294
-
295
-
296
-
297
-
298
-
299
-
300
-
301
-
302
-
303
-
304
-
305
-
306
-
307
-
308
-
309
-
310
-
311
-
312
-
313
-
314
-
315
-
316
-
317
-
318
-
319
-
320
-
321
-
322
-
323
-
324
-
325
-
326
-
327
-
328
-
329
-
330
-
331
-
332
 |
 |

4BUSINESS REVIEW
REVIEW OF THE CONSOLIDATED FINANCIAL STATEMENTS
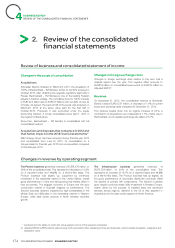
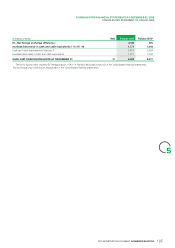
Profit for the period
Profit for the period attributable to the equity holders of our parent company amounted to EUR1,888million for the year ended
December31, 2013, that is a 4.1% increase over the EUR1,813million profit for the year ended December31, 2012 (restated for the
application of IAS19 Revised disclosed in note1.2 of the consolidated financial statements).
Earnings per share
Earnings per share increased to EUR3.43 for the year ended December31, 2013 from EUR3.34 for the year ended December31, 2012
(restated for the application of IAS19 Revised disclosed in note1.2 of the consolidated financial statements).
Consolidated cash-flow
Operating Activities
Our acquisitions represented a cash outflow, net of cash acquired,
of EUR294million for the year ended December31, 2013,
Net cash provided by operating activities before changes in corresponding mainly to Electroshield – TM Samara, compared to
operating assets and liabilities reached EUR2,673million for the EUR242million in the year ended December31, 2012
year ended December31, 2013, down 4.6% compared to corresponding partially to M&C Energy Group.
EUR2,802million for the year ended December31, 2012, and The EUR121million proceeds from sale of financial assets in2012
represented 11.3% of revenue in2013 compared with 11.7% corresponded to the proceeds net of fees of the sale of AXA
in2012. shares in September2012.
Change in working capital requirement generated EUR228million
Financing Activities
in cash in the year ended December31, 2013, compared to
EUR1million in consumption in the year ended December31,
2012, with continuing operational efficiency actions. The bond issuance of EUR600million corresponds to a
In all, net cash provided by operating activities increased 3.6% EUR600million bond issue in September2013 due 2021 as part
from EUR2,801million in the year ended December31, 2012 to of the EMTN program. The Group reimbursed two bonds in 2013
EUR2,901million in the year ended December31, 2013. for EUR587million.
Investing Activities
The net increase in other financial debts amount to
EUR1,066million during the year ended December31, 2013,
compared to a decrease of EUR585million during the year ended
Net capital expenditure, which included capitalized development December31, 2012. The dividend paid by Schneider Electric was
projects, decreased by 0.6% to EUR714million for the year ended EUR1,025million the year ended December31, 2013, compared
December31, 2013, compared to EUR719million for the year with EUR919million the year ended December31, 2012.
ended December31, 2012, and represented 3.0% of revenues.
178 2013 REGISTRATION DOCUMENT SCHNEIDER ELECTRIC