APC 2013 Annual Report Download - page 81
Download and view the complete annual report
Please find page 81 of the 2013 APC annual report below. You can navigate through the pages in the report by either clicking on the pages listed below, or by using the keyword search tool below to find specific information within the annual report.-
 1
1 -
2
-
3
-
4
-
5
-
6
-
7
-
8
-
9
-
10
-
11
-
12
-
13
-
14
-
15
-
16
-
17
-
18
-
19
-
20
-
21
-
22
-
23
-
24
-
25
-
26
-
27
-
28
-
29
-
30
-
31
-
32
-
33
-
34
-
35
-
36
-
37
-
38
-
39
-
40
-
41
-
42
-
43
-
44
-
45
-
46
-
47
-
48
-
49
-
50
-
51
-
52
-
53
-
54
-
55
-
56
-
57
-
58
-
59
-
60
-
61
-
62
-
63
-
64
-
65
-
66
-
67
-
68
-
69
-
70
-
 71
71 -
 72
72 -
 73
73 -
 74
74 -
 75
75 -
 76
76 -
 77
77 -
 78
78 -
 79
79 -
 80
80 -
 81
81 -
 82
82 -
 83
83 -
 84
84 -
 85
85 -
 86
86 -
 87
87 -
 88
88 -
 89
89 -
 90
90 -
 91
91 -
92
-
93
-
94
-
95
-
96
-
97
-
98
-
99
-
100
-
101
-
102
-
103
-
104
-
105
-
106
-
107
-
108
-
109
-
110
-
111
-
112
-
113
-
114
-
115
-
116
-
117
-
118
-
119
-
120
-
121
-
122
-
123
-
124
-
125
-
126
-
127
-
128
-
129
-
130
-
131
-
132
-
133
-
134
-
135
-
136
-
137
-
138
-
139
-
140
-
141
-
142
-
143
-
144
-
145
-
146
-
147
-
148
-
149
-
150
-
151
-
152
-
153
-
154
-
155
-
156
-
157
-
158
-
159
-
160
-
161
-
162
-
163
-
164
-
165
-
166
-
167
-
168
-
169
-
170
-
171
-
172
-
173
-
174
-
175
-
176
-
177
-
178
-
179
-
180
-
181
-
182
-
183
-
184
-
185
-
186
-
187
-
188
-
189
-
190
-
191
-
192
-
193
-
194
-
195
-
196
-
197
-
198
-
199
-
200
-
201
-
202
-
203
-
204
-
205
-
206
-
207
-
208
-
209
-
210
-
211
-
212
-
213
-
214
-
215
-
216
-
217
-
218
-
219
-
220
-
221
-
222
-
223
-
224
-
225
-
226
-
227
-
228
-
229
-
230
-
231
-
232
-
233
-
234
-
235
-
236
-
237
-
238
-
239
-
240
-
241
-
242
-
243
-
244
-
245
-
246
-
247
-
248
-
249
-
250
-
251
-
252
-
253
-
254
-
255
-
256
-
257
-
258
-
259
-
260
-
261
-
262
-
263
-
264
-
265
-
266
-
267
-
268
-
269
-
270
-
271
-
272
-
273
-
274
-
275
-
276
-
277
-
278
-
279
-
280
-
281
-
282
-
283
-
284
-
285
-
286
-
287
-
288
-
289
-
290
-
291
-
292
-
293
-
294
-
295
-
296
-
297
-
298
-
299
-
300
-
301
-
302
-
303
-
304
-
305
-
306
-
307
-
308
-
309
-
310
-
311
-
312
-
313
-
314
-
315
-
316
-
317
-
318
-
319
-
320
-
321
-
322
-
323
-
324
-
325
-
326
-
327
-
328
-
329
-
330
-
331
-
332
 |
 |

SUSTAINABLE DEVELOPMENT
SCHNEIDER ELECTRIC’S COMMITMENT TO ENVIRONMENTAL PERFORMANCE
Finally, on EverBlue perimeter, the reduction of water consumption In2012, Schneider Electric confirmed the challenge of maintaining
in 2013 reaches 15% versus 2011 baseline (data normalized on for this objective in the new company program through 2012-2014, in
headcounts and activity evolution). In only 2 years, the overall addition to better understand the root causes of the 15% not
Group objective of 10% reduction in 3 years has been exceeded. recovered.
Energy consumption
Therefore, in 2013 the Group began to consolidate hazardous
waste at group level but, as classification systems vary widely from
See the Group’s energy consumption action plans on country to country, the Group is under fine tuning the consolidation
pages72-73. methodology by category of waste.
Raw material consumption
In addition, thanks to a specific survey enabled by its new reporting
system, the Group confirmed that the waste from metal was
Schneider Electric focuses on making its devices more compact to
2
recovered at close to 100%.
conserve natural resources so that customers have more
environmentally friendly products to choose from. The Group has Data is processed to ensure local traceability. All waste is
developed design tools for managing thermal and electrical channelled to the appropriate treatment facility.
constraints so that it can optimize the amount of materials required Schneider Electric notes the quantities of waste produced and
in production. Each device’s Product Environmental Profile (PEP) recycled on a six monthly basis and monitors this production per
lists the materials used. To facilitate end-of-life processing, capita, on a like-for-like basis in order to evaluate its performance
Schneider Electric chooses materials that are easy to recycle and from one year to the next.
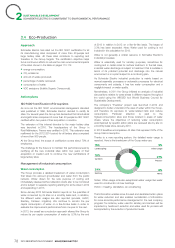
clip-together components that are easy to disassemble. Life cycle The overall eco-production approach helped reduce our
analyses and recyclability assessments also help the Group identify production of waste per capita in2013 compared with 2012 on a
areas for improvement. comparable basis and to increase the proportion of waste recycled
For more information on the Schneider Electric global action plan from 85.6% at the end of2012 to 86.7% at the end of2013 on a
relating to PEP and to end-of-life instructions, see the chapter comparable basis (target of 85% was actually exceeded).
dedicated to Green Premium on pages75-77. Also, see Green
Conditions of use and contamination of soils
Plastic program on page77.
Schneider Electric’s desire to reduce its environmental impact has Virtually all Schneider Electric sites are located in urban or industrial
driven its focus towards the use of recycled raw materials. For areas and do not affect any notable biotopes. None of the Group’s
example, about 85% of cardboard used in Europe, 100% in Asia businesses involve extraction or land farming.
and 60% in North America comes from recycled material (source: No substances are purposely released into the soil in the course of
Purchasing data). With regard to metals that Schneider Electric site operation. Workshop flooring at risk is given a waterproof seal
purchases globally, these include recycled material from recovered using a suitable treatment (resin retention). Hazardous substances
waste. A UNEP (United Nations Environment Program) report was are systematically stored and handled in areas equipped with
published in2011 addressing the situation with regard to metal retention tanks in compliance with regulations. As a result of
recycling rates. On a global level, 18metals have a recycling rate of developments in legislation, retention systems are being designed
over 50%: lead, gold, silver, aluminium, tin, nickel, zinc, copper more and more to compensate in the event of malfunctions or
and iron among others, and 34elements have a recovery rate emergencies, such as fires.
below 1%, including rare earth elements. The UNEP recommends
In2013 Schneider Electric conducted its annual review of pollution
that priority be given to product design in order to facilitate
risks at all manufacturing sites as part of ISO14001 tracking. No
disassembly and recovery of metals at end of life and to emphasize
major incidents were reported in2013.
recycling electrical and electronic equipment (WEEE). Schneider
Electric participates in the recycling systems via the recovery of its
Discharge into the water and air
own waste, with a target of 85% in2013, and the End-of-Life
Instructions for its products. Because Schneider Electric is mainly an assembler, its discharge
into the air and water is very limited. Mechanical component
Management of waste, emissions and industrial
production workshops are carefully monitored, in keeping with their
pollution
ISO14001 certification. Their releases are tracked locally as
required by current legislation. No major spills or discharges were
Waste
reported in2013.
Because waste is a major source of pollution but also a potential Emissions of NOx and SOx and particlesinto the air are monitored
source of raw materials, waste management is a priority in site by site according to their heating activity; monitoring of these
environmental protection. emissions is verified via ISO14001 audits. Emissions are then
monitored by the site managers with respect to the thresholds
Most of Schneider Electric’s waste is solid waste. Continuous defined in local legislation and monitored by the heads of the
improvement plans have been deployed to manage this waste. geographical areas (see organization page71). These emissions
This approach is fully in line with the framework of ISO14001 are not subject to consolidation at Group level.
certification that all Schneider Electric production and logistics sites
worldwide are required to follow. The VOC emissions have been identified as representative of
Group levels and are therefore included in Group reporting.
The target through 2009-2011 was to recover 85% of hazardous
and non-hazardous waste.
79
2013 REGISTRATION DOCUMENT SCHNEIDER ELECTRIC