APC 2013 Annual Report Download - page 211
Download and view the complete annual report
Please find page 211 of the 2013 APC annual report below. You can navigate through the pages in the report by either clicking on the pages listed below, or by using the keyword search tool below to find specific information within the annual report.-
 1
1 -
2
-
3
-
4
-
5
-
6
-
7
-
8
-
9
-
10
-
11
-
12
-
13
-
14
-
15
-
16
-
17
-
18
-
19
-
20
-
21
-
22
-
23
-
24
-
25
-
26
-
27
-
28
-
29
-
30
-
31
-
32
-
33
-
34
-
35
-
36
-
37
-
38
-
39
-
40
-
41
-
42
-
43
-
44
-
45
-
46
-
47
-
48
-
49
-
50
-
51
-
52
-
53
-
54
-
55
-
56
-
57
-
58
-
59
-
60
-
61
-
62
-
63
-
64
-
65
-
66
-
67
-
68
-
69
-
70
-
71
-
72
-
73
-
74
-
75
-
76
-
77
-
78
-
79
-
80
-
81
-
82
-
83
-
84
-
85
-
86
-
87
-
88
-
89
-
90
-
91
-
92
-
93
-
94
-
95
-
96
-
97
-
98
-
99
-
100
-
101
-
102
-
103
-
104
-
105
-
106
-
107
-
108
-
109
-
110
-
111
-
112
-
113
-
114
-
115
-
116
-
117
-
118
-
119
-
120
-
121
-
122
-
123
-
124
-
125
-
126
-
127
-
128
-
129
-
130
-
131
-
132
-
133
-
134
-
135
-
136
-
137
-
138
-
139
-
140
-
141
-
142
-
143
-
144
-
145
-
146
-
147
-
148
-
149
-
150
-
151
-
152
-
153
-
154
-
155
-
156
-
157
-
158
-
159
-
160
-
161
-
162
-
163
-
164
-
165
-
166
-
167
-
168
-
169
-
170
-
171
-
172
-
173
-
174
-
175
-
176
-
177
-
178
-
179
-
180
-
181
-
182
-
183
-
184
-
185
-
186
-
187
-
188
-
189
-
190
-
191
-
192
-
193
-
194
-
195
-
196
-
197
-
198
-
199
-
200
-
 201
201 -
 202
202 -
 203
203 -
 204
204 -
 205
205 -
 206
206 -
 207
207 -
 208
208 -
 209
209 -
 210
210 -
 211
211 -
 212
212 -
 213
213 -
 214
214 -
 215
215 -
 216
216 -
 217
217 -
 218
218 -
 219
219 -
 220
220 -
 221
221 -
222
-
223
-
224
-
225
-
226
-
227
-
228
-
229
-
230
-
231
-
232
-
233
-
234
-
235
-
236
-
237
-
238
-
239
-
240
-
241
-
242
-
243
-
244
-
245
-
246
-
247
-
248
-
249
-
250
-
251
-
252
-
253
-
254
-
255
-
256
-
257
-
258
-
259
-
260
-
261
-
262
-
263
-
264
-
265
-
266
-
267
-
268
-
269
-
270
-
271
-
272
-
273
-
274
-
275
-
276
-
277
-
278
-
279
-
280
-
281
-
282
-
283
-
284
-
285
-
286
-
287
-
288
-
289
-
290
-
291
-
292
-
293
-
294
-
295
-
296
-
297
-
298
-
299
-
300
-
301
-
302
-
303
-
304
-
305
-
306
-
307
-
308
-
309
-
310
-
311
-
312
-
313
-
314
-
315
-
316
-
317
-
318
-
319
-
320
-
321
-
322
-
323
-
324
-
325
-
326
-
327
-
328
-
329
-
330
-
331
-
332
 |
 |

CONSOLIDATED FINANCIALSTATEMENTS ATDECEMBER 31, 2013
NOTES TO THE CONSOLIDATED FINANCIAL STATEMENTS
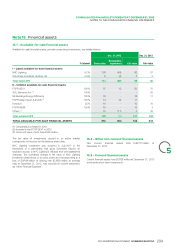
Financial assets
Note15
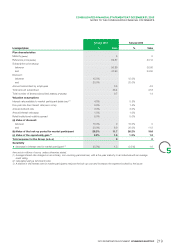
15.1 – Available-for-sale financial assets
Available-for-sale financial assets, primarily comprising investments, are detailed below:
Dec.31, 2013 Dec.31, 2012
Revaluation/
% interest Gross value Fair value Fair valueimpairment
I – Listed available-for-sale financial assets
NVC Lighting 9.2% 108 (48) 60 57
Gold Peak Industries Holding Ltd 4.4% 6 (4) 33
Total listed AFS 114 (52) 63 60
II – Unlisted available-for-sale financial assets
FCPRSEV1 100% 37 13 50 70
SCL Elements Inc.(1) 100% ---20
SE Buildings Energy Efficiency 100% 16 - 16 17
FCPR Aster II (part A and B) (2) 100% 14 (3) 11 -
Inversion 35% 10 - 10 10
FCPR SESS 100% 10 - 10 3
Others(3) 15 (11) 433
Total unlisted AFS 102 (1) 101 153
TOTAL AVAILABLE-FOR-SALE FINANCIAL ASSETS 216 (53) 164 213
Companies purchased in2012.(1)
Included in line FCPR SEV1 in 2012.(2)
Gross unit value of less than EUR5million.(3)
The fair value of investments quoted in an active market
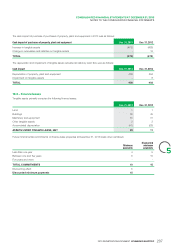
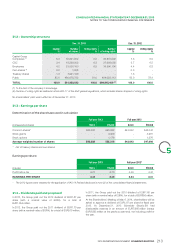
15.2 – Other non-current financial assets
corresponds to the price on the balance sheet date. Non Current financial assets total EUR127million at
NVC Lighting investment was acquired in July2011 in the December31, 2013.
5
framework of a partnership that gives Schneider Electric an
Current financial assets15.3 –
exclusive access to NVC Lighting’s diffused and well established
channels. The cumulated change in fair value of NVC Lighting
investment determined on its price share and corresponding to a Current financial assets total EUR28million at December31, 2013
loss of EUR48million at closing rate (EUR50million at average and include short-term investments.
rate) at December31, 2013, was recorded in income statement,
as “Other Financial Expense”.
209
2013 REGISTRATION DOCUMENT SCHNEIDER ELECTRIC