APC 2013 Annual Report Download - page 184
Download and view the complete annual report
Please find page 184 of the 2013 APC annual report below. You can navigate through the pages in the report by either clicking on the pages listed below, or by using the keyword search tool below to find specific information within the annual report.-
 1
1 -
2
-
3
-
4
-
5
-
6
-
7
-
8
-
9
-
10
-
11
-
12
-
13
-
14
-
15
-
16
-
17
-
18
-
19
-
20
-
21
-
22
-
23
-
24
-
25
-
26
-
27
-
28
-
29
-
30
-
31
-
32
-
33
-
34
-
35
-
36
-
37
-
38
-
39
-
40
-
41
-
42
-
43
-
44
-
45
-
46
-
47
-
48
-
49
-
50
-
51
-
52
-
53
-
54
-
55
-
56
-
57
-
58
-
59
-
60
-
61
-
62
-
63
-
64
-
65
-
66
-
67
-
68
-
69
-
70
-
71
-
72
-
73
-
74
-
75
-
76
-
77
-
78
-
79
-
80
-
81
-
82
-
83
-
84
-
85
-
86
-
87
-
88
-
89
-
90
-
91
-
92
-
93
-
94
-
95
-
96
-
97
-
98
-
99
-
100
-
101
-
102
-
103
-
104
-
105
-
106
-
107
-
108
-
109
-
110
-
111
-
112
-
113
-
114
-
115
-
116
-
117
-
118
-
119
-
120
-
121
-
122
-
123
-
124
-
125
-
126
-
127
-
128
-
129
-
130
-
131
-
132
-
133
-
134
-
135
-
136
-
137
-
138
-
139
-
140
-
141
-
142
-
143
-
144
-
145
-
146
-
147
-
148
-
149
-
150
-
151
-
152
-
153
-
154
-
155
-
156
-
157
-
158
-
159
-
160
-
161
-
162
-
163
-
164
-
165
-
166
-
167
-
168
-
169
-
170
-
171
-
172
-
173
-
 174
174 -
 175
175 -
 176
176 -
 177
177 -
 178
178 -
 179
179 -
 180
180 -
 181
181 -
 182
182 -
 183
183 -
 184
184 -
 185
185 -
 186
186 -
 187
187 -
 188
188 -
 189
189 -
 190
190 -
 191
191 -
 192
192 -
 193
193 -
 194
194 -
195
-
196
-
197
-
198
-
199
-
200
-
201
-
202
-
203
-
204
-
205
-
206
-
207
-
208
-
209
-
210
-
211
-
212
-
213
-
214
-
215
-
216
-
217
-
218
-
219
-
220
-
221
-
222
-
223
-
224
-
225
-
226
-
227
-
228
-
229
-
230
-
231
-
232
-
233
-
234
-
235
-
236
-
237
-
238
-
239
-
240
-
241
-
242
-
243
-
244
-
245
-
246
-
247
-
248
-
249
-
250
-
251
-
252
-
253
-
254
-
255
-
256
-
257
-
258
-
259
-
260
-
261
-
262
-
263
-
264
-
265
-
266
-
267
-
268
-
269
-
270
-
271
-
272
-
273
-
274
-
275
-
276
-
277
-
278
-
279
-
280
-
281
-
282
-
283
-
284
-
285
-
286
-
287
-
288
-
289
-
290
-
291
-
292
-
293
-
294
-
295
-
296
-
297
-
298
-
299
-
300
-
301
-
302
-
303
-
304
-
305
-
306
-
307
-
308
-
309
-
310
-
311
-
312
-
313
-
314
-
315
-
316
-
317
-
318
-
319
-
320
-
321
-
322
-
323
-
324
-
325
-
326
-
327
-
328
-
329
-
330
-
331
-
332
 |
 |

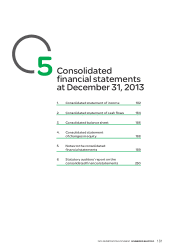
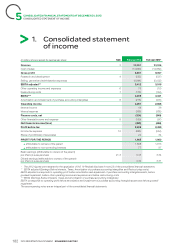
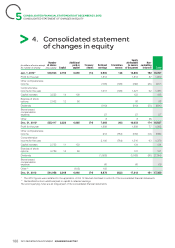
5CONSOLIDATED FINANCIALSTATEMENTS ATDECEMBER 31, 2013
CONSOLIDATED STATEMENT OF INCOME
Consolidated statement
1.
ofincome
(inmillions of euros except for earnings per share) Note Full year 2013 Full year 2012*
Revenue 323,551 23,946
Cost of sales (14,660) (14,889)
Gross profit 8,891 9,057
Research and development 4 (535) (507)
Selling, general and administrative expenses (4,944) (5,035)
EBITA adjusted** 3,412 3,515
Other operating income and expenses 6 73 (10)
Restructuring costs 7 (176) (164)
EBITA*** 3,309 3,341
Amortization and impairment of purchase accounting intangibles 8 (218) (475)
Operating income 3,091 2,866
Interest income 44 36
Interest expense (368) (385)
Finance costs, net (324) (349)
Other financial income and expense 9 (159) (97)
Net financial income/(loss) (483) (446)
Profit before tax 2,608 2,420
Income tax expense 10 (665) (554)
Share of profit/(loss) of associates 22 34
PROFIT FOR THE PERIOD 1,965 1,900
attributable to owners of the parent
●1,888 1,813
attributable to non-controlling interests
●77 87
Basic earnings (attributable to owners of the parent)
21.3 3.43 3.34per share (in euros pershare)
Diluted earnings (attributable to owners of the parent) 3.40 3.31per share (in euros per share)
The 2012 figures were restated for the application of IAS19 Revised disclosed in note22 of the consolidated financial statements.
*
EBITA adjusted (Earnings Before Interests, Taxes, Amortization of purchase accounting intangibles and Restructuring costs).
*
*
EBITA adjusted corresponds to operating profit before amortization and impairment of purchase accounting intangible assets, before
goodwill impairment, before other operating income and expenses and before restructuring costs.
EBITA (Earnings Before Interests, Taxes and Amortization of purchase accounting intangibles)
*
*
*
EBITA corresponds to operating profit before amortization and impairment of purchase accounting intangible assets and before goodwill
impairment.
The accompanying notes are an integral part of the consolidated financial statements.
182 2013 REGISTRATION DOCUMENT SCHNEIDER ELECTRIC